The Economic Impact of Climatic Change Variables on Trend of Crops Production.
Hanan E El habeeb Elemam1, Hamdon A Abdelrhman3,1*, Maruod E Maruod, Mohamed Babekir2 elgali, Paridah MT3, Khalina Abdan3, Salih Tutu
1 University of Kordofan, Faculty of Natural Resources and Environmental studies. Development of Agricultural Economics and Agribusiness Elobied, Sudan.
2 Gezeira, Faculty of Agriculture,Department of Agricultural economics and Rural Development, Sudan.
*Corresponding Author: Hamdon A Abdelrhman Laboratory of Biocomposite Technology, Institute of Tropical Forestry and Forest Products (INTROP), Universiti Putra Malaysia (UPM), 43400 Serdang, Selangor, Malaysia. Tel: 03-9769 7990; Fax: 03-9769 7990; E-mail: hamdonun2012@gmail.com
Citation: Hanan E El habeeb Elemam, Hamdon A Abdelrhman, Maruod E. Maruod, Mohamed Babekir elgali, Paridah MT, et al. (2023) The Economic Impact of Climatic Change Variables on Trend of Crops Production. Sci Environm 6: 176.
Received: March 29, 2023; Accepted: April 22, 2023; Published: April 26, 2023.
Abstract
The main objective of this work is to investigate the economic impact of climatic variables on crops production cross years (2005-2014 cropping season) in Sheikan locality. The primary data were collected from the households via questionnaire (250) respondents selected randomly by a multi-stage random sampling technique, while secondary data was collected from reports, journals, books and internet. The statistical analysis and time series method were used to analyze the collected data. The results showed that total crop production varies from cropping season to another. According to the climatic variables such as rainfall rate, temperature and humidity, the highest total production of millet illustrated (4,950 ton) was in cropping season while the lowest (862 ton) was in the cropping season at average temperatures 34.5 oC and 35.2 oC, and total rainfall 556.2 and 400mm respectively. Sorghum produced the highest total production (19,673 tons) in cropping season and lowest (2,863 ton) in the same climatic factors’ degree of millet. The highest production of sesame was (18,617 ton) in cropping season while the lowest (3,217 ton) was recorded in cropping season at average temperatures 34.6 oC and 35.2 oC and total rainfall 647 and 400mm respectively. Accordingly, groundnut production the analysis showed that the highest production was (16,406 ton) in the cropping season while lowest (4,535 ton) was in at average temperatures 34.6 oC and 35.2 oC, and total rainfall equal to 556.2 and 400mm respectively. We concluded that production increases with reduction of climatic variables such as rainfall and temperature and humidity.
Keywords
Keywords: Climatic Variables, Rainfall, Temperature Crops Production, Food Security.
Introduction
The effects of climate changes and extreme weather events in the recent past have undermined progress in the alleviation of poverty and food insecurity, while also having a negative effect on overall development efforts (Ray et al., 2019). Economic sectors that largely depend on weather conditions – either directly or indirectly – most notably agriculture and fisheries are increasingly subject to the impacts of climate change (IPCC, 2012 and 2017). Moreover, the depletion of natural resources, as a result of increased environmental and demographic pressures, tends to aggravate the severity of climate change impacts. All in all, there are increasing concerns about the rising threats to current income and consumption patterns of households and individuals that earn their livelihoods from these sectors, (Foresight, 2011; IPCC, 2012; IPCC, 2017).
Sudan is characterized by a wide range of climate variations which vary from desert in the northern part of Sudan, where it seldom rains, through a southern belt of varying summer rainfall, to an almost equatorial type of rain in the extreme southwest, where the dry season is very short. The main factor determining the climate of the region is the seasonal shift of the Inter-Tropical Convergence Zone (ITCZ), the front of which moves with the changing zenithal position of the sun (Van noordwijk, 1984 and Siddig et al.., 2020). During the winter months, from October to March, pressure is high over the Sahara and the dry north winds blows across Sudan and towards the ITCZ which may lie as far to the south as the Tropic of Capricorn. With the advance of the sun towards the summer solstice, the zone of the convergence of northerly and southerly air streams moves northwards across Sudan and moist, unstable air is drawn from the South Atlantic Ocean (Wickens, 1976; Nirmala & Mohamed, 2018; Elhag & Zhang, 2018).
The changes in crop related climatic variables will possibly have major influences on regional as well as global food production (M.G. Abraha, M.J. Savage, 2006). The likely impacts of climate change on crop yield can be determined either by experimental data or by crop growth simulation models. To predict future impacts on crop yields, crop models present valuable approaches. Climate change impacts on crop yield are different in various areas, in some regions it will increase, in others it will decrease which is concerned with the latitude of the area and irrigation application. The crop yield can be increased with irrigation application and precipitation increase during the crop growth; meanwhile, crop yield is more sensitive to the precipitation than temperature. If water availability is reduced in the future, soil of high-water holding capacity will be better to reduce the frequency of drought and improve the crop yield (Popova & Kercheva, 2005; Dokoohaki et al., 2017).
Material and Methods
The study area covers Sheikan locality in North Kordofan State, Sudan. This State includes (Sheikan, Bara, Um Ruwaba and Elrahad Localities) which lie between latitude 12º 00 — – 16º30 — N and longitude 27º 00— – 32º 25— E. The State has been characterized by being desert north of latitude 16 with annual rainfall less than 100 mm; and semi desert features between latitude 14º 25 — – 16º 00— with annual rainfall 100 -250 mm; arid features between latitude 13º25 — – 14º 25 — with annual rainfall 250 - 350 mm; and semiarid features south latitude 13º 25— with annual rainfall more than 350 mm, ( Ministry of Agriculture, 1990). Generally, the annual rainfall varies between 100- 400 mm; the distribution of rainfall over the wet season is an important consideration in the explanation of the variation in crop yield. Broadly, the soil of the study area can be classified into three main groups as sandy soil (Goz) group, fine texture group and clay soil group. The sandy soil (Goz) consists of stabilized sand dunes. This type of soil, despite its low fertility and low water holding capacity, is intensively cultivated due to its loose structure, which makes it easy to cultivate and facilitates the development of fine root system of crops. Compensate for the major crops grown in the sandy soil are millet, groundnut, sesame, watermelon and Roselle. Fine texture soil group consists of gardud, Jurraba and wadi soil. The gardud soil is a group of non-cracking sandy-clay and it is very hard to cultivate by hand-tools, and suitable for cultivation of both milt and sorghum though better in sorghum. Jurraba is a soil type related to gardud and it yields good crops such as sorghum, okra, cowpea and sesame. Wadi soils consist of dark clays and they are generally found along seasonal watercourses and the crops grown here sorghum and okra, which require more water. In addition to the mentioned predominant soil types, there are scattered pockets of clay soils over the study area particularly in Er-Rahad area (Jebel El Dair). This soil type is suitable for mechanized cultivation of sorghum and sesame crops. Diversification of soil types and climatic conditions resulted in diversification of vegetation cover throughout the study area. The northern part is generally covered with scarce desert and semi-desert scrub; the central part is covered with Acacia spp., which gives way to the broad-leafed Savannah woodland of South Kordofan. The area is subjected to further degradation due to hardship environmental condition, climatic instability, desert moving to the south, recurrent drought, cutting down of trees for various uses, over cultivation, and over grazing.
Data sources and Sampling Procedure
The research used both primary and secondary data. The primary data was collected from the households via questionnaire (250) respondents selected randomly. A multi-stage random sampling technique divided the state into localities and was divided it to administrative units and the villages were selected from each administrative unit and the households were selected from each village. In addition, secondary data was collected from different institutional sources. SPSS software was used for statistical analysis of questionnaires data referring to the two seasons 2012/2013 and 2013/2014 and it was collected in the period September - December 2014.
Sample size and sampling Technique
Due to the homogeneity of the population in rural areas of North Kordofan State and their similarity of socio-economic activities and social characteristics, the sample size was assumed to be (250) respondents. According to the formula below:
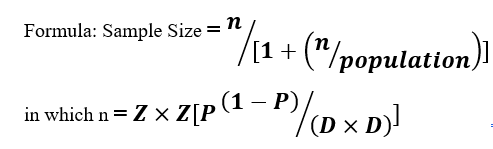
(Oman medj, 2013).
The sample size is assumed to be 250. Due to Z =1.96, P=10% and D= 14% - 10% or 10% - 6 %= (4%) where:
P = True proportion of factor in the population, or the expected frequency value
D = Maximum difference between the sample mean and the population mean, Or Expected Frequency Value minus (-) Worst Acceptable Value
Z = Area under normal curve corresponding to the desired confidence level
Confidence Level/Value for Z = 95%/1.960
Tools of analysis
To satisfy the objectives of the study; the time series analysis was conducted to investigate the trend of crop production cross climatic variables during 2005-2014 which was collected from secondary data source.
Time Series Data Analysis
Many statistical methods relate to data which are independent, or at least uncorrelated. There are many practical situations where data might be correlated. This is particularly so where repeated observations on a given system are made sequentially in time. Data gathered sequentially in time are called a time series (Term, 2010).
Definitions
Assume that the series Xt runs throughout time, that is (Xt)t = 0, }1, } 2..., but is only observed at times t = 1, . . ., n.
So, we observe (X1, …. Xn). Theoretical properties refer to the underlying Process (Xt)t∈Z.
The notations Xt and X (t) are interchangeable.
The theory for time series is based on the assumption of ‘second-order stationarity’. Real-life data are often not stationary: e.g., they exhibit a linear trend over time, or they have a seasonal effect. So, the assumptions of stationarity below apply after any trends/seasonal effects have been removed. (We will look at the issues of trends/seasonal effects later.)
A plot of rt against t is called the correlogram.
A series (Xt) is said to be lagged if its time axis is shifted: shifting by τ lags gives the series (Xt−τ).
So rt is the estimated autocorrelation at lag t; it is also called the sample Auto-correlation function.
Results
Perceptions of Households on Crop Production versus Climatic Variables
In table (1) illustrated that temperature, rainfall, weather fluctuation, crop production and flood. Respondents who mentioned increase of day temperature were (35.2%) in Sheikan locality, rain fall fluctuation is (46.2%) and weather fluctuation is (1.1%) and those who observed the decreased in crops production about (15.4%). With respect to flooding, households stated that about (2.2%).
Table 1: the Opinions of Households toward the Denotations of Climate Change, Skeikan Locality.
|
Incident |
Valid % |
|
|
Increasing temperature |
32 |
35.2 |
|
Rainfall fluctuation |
42 |
46.2 |
|
Weather fluctuation |
1 |
1.1 |
|
crop production |
14 |
15.4 |
|
Flood |
2 |
2.2 |
|
Total |
91 |
100.0 |
|
Not cited |
19 |
- |
|
Total |
110 |
100 |
Perceptions of households according to shocks of direct impact of climate change on food system and food chain Sheikan locality
The shocks and direct impact of climate change that households reported due to weather fluctuation impact on food system were in specific for product failure was 71.3%. Moreover, 6.4% of households mentioned that low water showed an impact on food system. Hence, about 10.6% of respondents perceive that the climate change adversely affected the food system and food chain in Sheikan locality. In addition, most of the respondents perceived that the higher temperature shocks and effects on food system were 40.4% also lower evaporation, lower soil fertility has an effect on the crop production; and human health, also can affect wildlife and animal death. On the other side the impact of rain fall fluctuation on food chain, 59.7% of respondents depicted lower quality and quantity of agricultural production while 18.2% of them has cited water decrease. This gives signs that the climatic variables had contributed much towards rural household’s food insecurity.
Table 2: Perceptions of households according to shocks of direct impact of climate change on food system and food chain, Sheikan locality.
|
Variables |
Valid % |
|
|
Weather fluctuation on food system |
||
|
product failure |
67 |
71.3 |
|
Animal death |
7 |
7.4 |
|
Low water |
6 |
6.4 |
|
Desertification |
4 |
4.3 |
|
Not cited |
16 |
- |
|
All |
10 |
10.6 |
|
Total |
110 |
100 |
|
Temperature on food system |
||
|
Increase evaporation and lower soil fertility |
38 |
40.4 |
|
Pests and diseases increase |
12 |
12.8 |
|
Affect crop production and human health |
32 |
34.1 |
|
Affect wildlife and animal health |
5 |
5.3 |
|
All |
7 |
7.4 |
|
Not cited |
||
|
Total |
110 |
100 |
|
Rain fall fluctuation on food chain |
||
|
Lower quality and quantity of agricultural production |
56 |
59.7 |
|
Decrease water |
27 |
28.6 |
|
All |
11 |
11.7 |
|
Not cited |
16 |
- |
|
Total |
110 |
100 |
Source: field survey 2014
Perceptions of households according to shocks of indirect climate change on food security dimensions, Sheikan locality
The impact of climate related to food availability among households revealed that decrease in crop production, decrease in forest production, increase food demand and finally showed by all the respondents, respectively. Regarding climate change effect on food access, respondents demonstrated that different percentage was resulted due to increase resource prices, affect livelihoods and income, increase migration and all, respectively. Statistical analysis pertaining climate change impact on food stability dimension stated that 12.7% of households believed that climate change affect prices and food availability, income, increase migration, and encourage resource conflicts and about (3.2%).
Trend of total crop production and climatic variables at Sheikan locality (2005-2014) cropping season)
We distributed the crops to the group food, oil and cash crops and then applied the analysis to investigate the impact of climate variables on crops production cross a year.
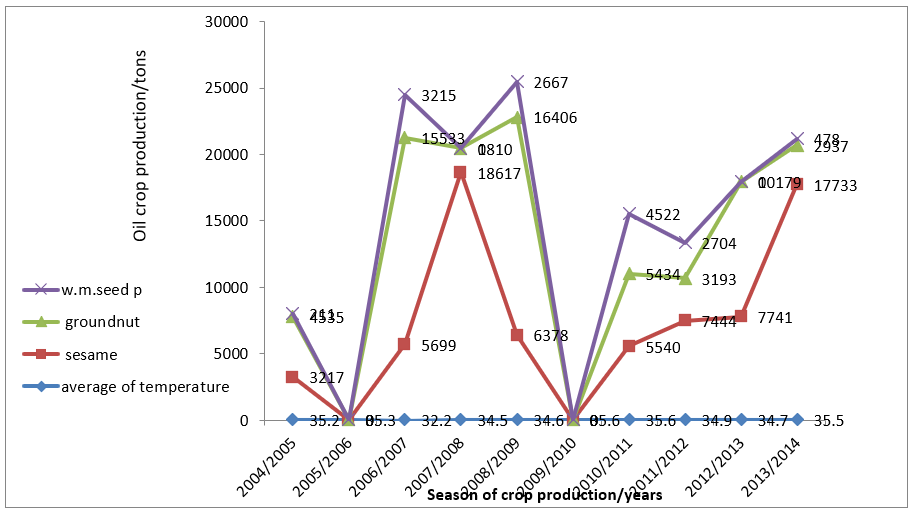
Figures (1) and (2) showed that total crop production varies from one cropping season to another. The highest total production of millet (4950 ton) was in cropping season while the lowest (862 ton) was in the cropping season at average temperatures 34.5oC, 35.2 oC, and total rainfall equal 556.2 and 400mm respectively. Sorghum produced the highest (19,673 ton) total production in cropping season and the lowest (2,863 ton) in the same climatic factor’s degree of millet, this means that the production increase with high rainfall and low temperature and decrease at low rainfall and high temperature. The highest production of sesame (18,617 ton) in cropping season whiles the lowest (3,217 ton) in cropping season at average temperatures 34.6 oC, 35.2 oC, and total rainfall equal 647 and 400mm respectively. Accordingly, groundnuts showed the highest production (16,406 ton) in the cropping season and the lowest (4,535 ton) in average temperatures 34.6 oC, 35.2 oC, and total rainfall equal 556.2 and 400mm respectively. The highest production of watermelon seed was (3,215 ton) in and the lowest was (411 ton) in, at average temperature 35.2 oC, 35.3 oC, and total rainfall equal 647 and 279.2mm respectively. With respect Roselle explored the highest production (9,193 ton) in cropping season while the lowest was (574 ton) in cropping season at average temperatures 35.2 oC, 34.5 oC, and total rainfall equals 556.2 and 400mm respectively. Cowpea revealed the highest production (4,261 ton) in the cropping season and lowest (577 ton) in cropping season. From figure, (3) the maximum average temperature for the period of growth of crop was (35.6 oC) in cropping season and the Lowest (35.2 oC) in cropping season, total rainfall for the period of crops growth showed that the highest annual rainfall (647.2mm) in the cropping season while the lowest was (279.2 mm). Also, the highest humidity percentage was 44% while the lowest humidity percentage was 38%.
Table 3: Perceptions of households’ shocks of climate change on food security dimensions, Sheikan locality.
|
Variables |
Valid % |
|
|
Food availability |
||
|
Decrease crop production locally and globally |
36 |
38.7 |
|
Decrease forest product |
22 |
23.4 |
|
Increase food demand |
32 |
33.4 |
|
All |
4 |
4.5 |
|
Not cited |
16 |
- |
|
Total |
110 |
100 |
|
Food access |
||
|
Increase resource prices |
1 |
1.1 |
|
Affect livelihoods and income |
20 |
21.3 |
|
Increase migration |
61 |
64.9 |
|
All |
12 |
12.7 |
|
Not cited |
16 |
- |
|
Total |
110 |
100 |
|
Food stability |
||
|
Affect prices and food availability |
18 |
19.1 |
|
Income |
25 |
26.6 |
|
Increase migration |
37 |
39.4 |
|
Encourage resource conflicts |
11 |
11.7 |
|
All |
3 |
3.2 |
|
Not cited |
16 |
- |
|
Total |
110 |
100 |
Source: field survey 2014
Figure 1: Chart of Sheikan showing food crop against average temperature.
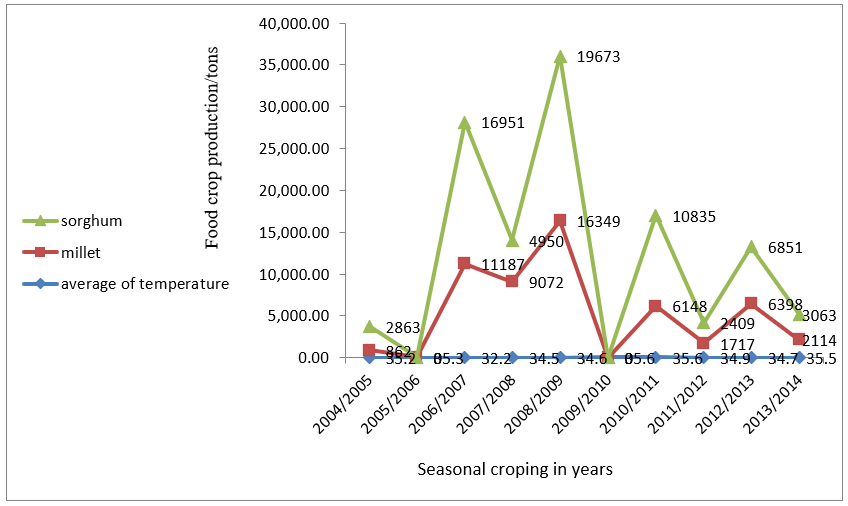
Figure 2: Chart of Sheikan showing food crop against average rainfall.
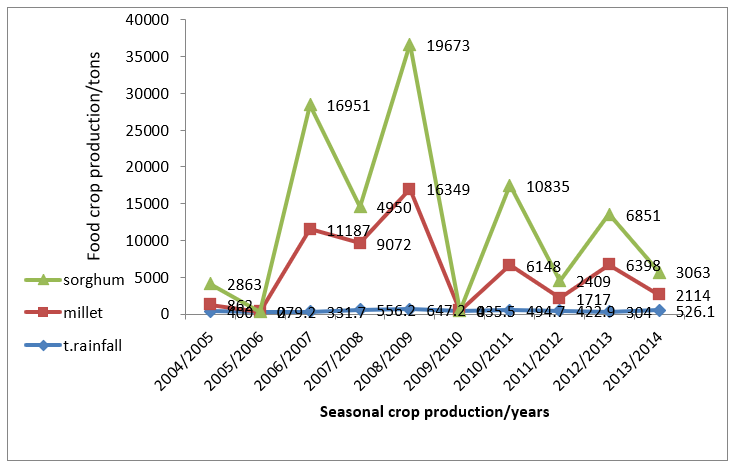
Figure 3: Chart of Sheikan showing oil crop against average temperature.
Discussion
The study indicated that farmers have awareness regard increase of day temperature; rain fall fluctuation and weather fluctuation are the main factors for decreasing crops production in Sheikan locality. This is may be agree with (Mohammed et al.., 2017) who stated that the majority of the respondents (68 %) appointed that seasonal variation in rainfall is the main characteristic of climate change. In Sub-Sahara Africa for examples (Hoffman et al., 2018) found that increasing temperatures reduced yields for all three crops in the temperature range observed, while precipitation increased yields up to a level roughly matching crop.
Furthermore, crop production is highly sensitive to the climate. The study highlights that climatic variables might have a negative impact on crop yield. This indicated a quantitative confirmation of findings climate change may affect food systems in several ways ranging from direct effects on crop production (e.g. changes in rainfall leading to drought or flooding, or warmer or cooler temperatures leading to changes in the length of growing season), to changes in markets, food prices and supply chain infrastructure (Gregory et al., 2005; Mal et al., 2018; Siddig et al., 2020; Tesfaye, 2021).
Agriculture and food security are influenced by many factors, for example socioeconomic conditions of farmers, also there was a complex and dynamic relationship between climate change and food security.
These results entailed that all dimensions of food security are likely to be linked more or less directly by climate variability the results are in the line of IPCC, (2007) report which stated that, climate change will add a further dimension to the challenge of ensuring food security for all, with the poor in sub-Sahara Africa most vulnerable because of their restricted options for coping.
The study revealed that crops production was founded in a study area varied with climate variables during the period 2005 to 2014. This is in the line with FAO, (2017) stated that crops production is affected by a variety of climate factors: long-term trends in average rainfall and temperatures; inter-annual variability in temperatures and precipitation; the occurrence of shocks during specific stages in plant development; and extreme weather events. Moreover, Elagib et al., (2019) studied performance of major mechanized rain-fed agricultural production in Sudan: Sorghum vulnerability and resilience to climate since 1970. They found that during the period 1970–2016 sorghum production showed both increases and decreases in the average over time besides high year-to-year variability.
Conclusion
From the results we observed that the crop production increased with high rainfall and low temperature while it decreased in low rainfall and high temperature. The study concluded that climate change variables have harm the household economic situation and therefore the sustainable management climatic variable needs to be investigated, still the impact of rainfall fluctuation has a direct effect on crop production which leads to reducing the productivity of all the studied cash and food crops. In addition, sorghum is more resistant to climatic factors in North Kordofan state. Moreover, Watermelon as an oil crop has tolerant to studied climatic factors.
Recommendation:
Accordingly, this investigation recommends the following:
- Awareness raising program should be build up to the local community regarding climate changes and food production issues.
- Government, NGOs and donor agencies should collaborate to combat the climate change impact with respect to ensuring food security.
References
- Abraha MG, Savage M J (2006) Potential impacts of climate change on the grain yield of maize for the midlands of KwaZulu-Natal, South Africa Agric Ecosyst Environ 115: 150–160.
- Ahmed E A (1986) Some aspects of dry land afforestation in the Sudan with special references to Acacia totilis (Forks.) Hayne, A. senegal Willd. And Prosopis chilelnsis (Molina) stuntz. Forest Ecology and Management 16: 209-221.
- Dokoohaki H, Gheysari M, Mousavi SF, Hoogenboom G, et al. (2017) Effects of different irrigation regimes on soil moisture availability evaluated by CSM-CERES-Maize model under semi-arid condition. Ecohydrology and Hydrobiology 17: 207–216.
- Elagib NA, Khalifa M, Rahma AE, Babker Z, Gamaledin SI, et al. (2019) Performance of major mechanized rainfed agricultural production in Sudan: Sorghum vulnerability and resilience to climate since 1970. Agricultural and Forest Meteorology 276–277, 107640.
- Elhag K, Zhang W (2018) Monitoring and assessment of drought focused on its impact on sorghum yield over Sudan by using meteorological drought indices for the period 2001–2011. Remote Sensing 10: 1231.
- FAO (2017). Agriculture Sourcebook Summary Climate-Smart (Second edi). FAO.
- Foresight UK (2011). The future of food and farming. Final Project Report, London, The Government Office for Science.
- Gregory PJ, Ingram JSI, Brklacich M (2005) Climate change and food security. Philosophical Transactions of the Royal Society B: Biological Sciences 360: 2139–2148.
- Hoffman A L, Kemanian AR, Forest C E (2018) Analysis of climate signals in the crop yield record of sub-Saharan Africa. Global Change Biology 24: 143–157.
- IPCC (2012). Managing the risks of extreme events and disasters to advance climate change adaptation (SREX). Special Report of the Intergovernmental Panel on Climate Change (IPCC).
- IPCC, PI sobre MC (2017) Special Report on climate change, desertification, land degradation, sustainable land management, food security, and greenhouse gas fluxes in terrestrial ecosystems (SR2). Ipcc, February 1–15.
- Jones PG, Thornton PK (2013) The potential impacts of climate change on maize production in Africa and Latin America in 2055. Global Environ.
- Mal S, Singh RB, Huggel C, Grover A, et al. (2018) Introducing Linkages Between Climate Change, Extreme Events, and Disaster Risk Reduction. In Climate change, extreme events and disaster risk reduction 1–14. Springer.
- Mohammed MH, Tutu SO, Adam H, Koli AO, Omer AN, et al. (2017) Agrarian Communities Awareness about Climate Change in Bara Locality - North Kordofan - Sudan. University of Kordofan Journal of Natural Resources and Environmental Studies eISSN 33–45.
- Ministry of Agriculture North Kordofan State, (1990) the annual report of agricultural season. Minstry of Agriculture, North Kordofan State, Sudan.
- Nirmala M, Mohamed T M (2018) Seasonal Predictability of Rinfall data using Box-Jenkins models in Kordofan State, Sudan. Indian Journal of Science and Technology 11: 1–9.
- Oman medj (2013) National library of medicine. National Institute of Health, OMAN MEDICAL JOURNAL.
- Popova Z, Kercheva M (2005) CERES model application for increasing preparedness to climate variability in agricultural planning—risk analyses. Physics and Chemistry of the Earth, Parts A/B/C 30: 117–124.
- Ray DK, West PC, Clark M, Gerber JS, Prishchepov AV et al. (2019) Climate change has likely already affected global food production. PLoS ONE, 14: e0217148.
- Siddig K, Stepanyan D, Wiebelt M, Grethe H, Zhu T et al. (2020) Climate change and agriculture in the Sudan: Impact pathways beyond changes in mean rainfall and temperature. Ecological Economics 169: 106566.
- Tesfaye K (2021) Climate change in the hottest wheat regions. Nature Food 2: 8–9.
- Saito K, Weidman C J (1990) Agricultural extension for women farmers in Africa. Washington, DC. World Bank.
- Term H, Reinert G (2010) Time series. Modern applied statistics with S. Springer 2-5.
- Van noordwijk M (1984) Climate. Ecological textbook for the Sudan. M. van noordwijk. Khartoum, Khartoum University Press.
- Wickens GE (1976) The Flora of Jebel Marra (Sudan Republic) and its geographical affinities. London, Royal Botanic Gardens, Kew. Kew Bulletin Additional Series V. London Her Majesty's Stationary Office.