Investigating the Electric-dipole Transitions of Eu3+ion Doped Ca1-xAl4O7: Eux via Co-Doping of Transition Metal Ion
Praveen Kumar Litoriya1*, Ashish Verma1
1Department of Physics, Dr. Harisingh Gour Vishwavidyalaya, Sagar (M.P.) (A Central University), India.
*Corresponding Author:Praveen Kumar Litoriya, Department of Physics, Dr. Harisingh Gour Vishwavidyalaya, Sagar (M.P.) (A Central University), Pincode- 470003, India, Tel: +91 9144199476; Fax: +91 9144199476; E-mail:praveenlitoriya01@gmail.com
Citation: Praveen Kumar Litoriya, Ashish Verma (2023) Investigating the Electric-dipole Transitions of Eu3+-ion Doped Ca1-xAl4O7: Eux via Co-Doping of Transition Metal ion. Nano Technol & Nano Sci J 5: 153.
Received: June 15, 2023; Accepted: June 25, 2023; Published: June 28, 2023.
Abstract
In this paper we report the photoluminescence behavior of rare earth and transition metal doped Eu3+ doped Ca0.87Q0.10Al4O7: Eu0.03 (Q= Sr, Mg) synthesized by urea fuel combustion method. The XRD analysis shows that the sample to be single phased in nature and crystallized into monoclinic phase with standard JCPDS 23-1037 card. The SEM & TEM analysis confirm the formation of nano particle, with average particle size around 30-80 nm. The elemental composition was confirmed by using Energy Dispersive X-ray (EDX) technique. The oxide formation was examined via FTIR technique. UV-Visible spectroscopy is used to study the optical band gap of material, it’s value in the current case, Ca0.87Q0.10Al4O7: Eu0.03 (Q= Sr) is 3.91eV. The photo-luminescence study revealed that it gives sharp emission peaks due to electric-dipole (E-D) and magnetic-dipole (M-D) transition using excitation wavelength λex= 394 nm. It is observed that the Eu3+ doped Ca0.87Q0.10Al4O7: Eu0.03 (Q= Ba, Ca, Mg) phosphor can be regulated as orange-red emission with the high color temperature and good color rendering index (CRI). The orange-red lights can regulate the circadian rhythm through melatonin, and it is also suitable for orange-red LED and other optoelectronic devices.
Keywords
Keywords:Combustion Method; Phosphor; Photoluminescence Properties; CIE Color Coordinates; Ptoelectronic Devices.
Introduction
Phosphor materials have attracted substantial attention for luminescent applications, particularly lighting applications. Aluminium related alkaline based phosphors emerged as a topic of extensive research over the last few decades due to their unique optical properties and their multitude of excellent advantages. It comprises a wide range of luminescence, a high quenching temperature, good stability, resistant radiation, and high quantum efficiency, among other advantages. The current interest focuses on novel down converting phosphors that can be effectively excited with near UV light. According to Park et al., several phases such as CaAl2O4, CaAl4O7, Ca3Al2O6, and Ca12Al14O33 can be obtained, with the CaAl2O4: Eu2+ phase contributing the most to a strong blue emission at 440nm with an excitation wavelength of 330 nm [1]. A well-known commercially available persistent luminous phosphor is Eu2+, Dy3+/Nd3+ co-doped CaAl2O4[2]. CaAl4O7 is a popular ceramic substance used in high-temperature refractories. It's also deployed as a component of high-alumina cement and as metallurgical slag in the steel industry. In the world of mineralogy, calcium dialuminate is known as "grossite" and can be found in natural terrestrial rock and meteorites [3]. This compound has recently attracted attention due to its remarkable crystallographic properties, specifically the presence of "triclusters," which consists of an oxygen atom which is surrounded by three Al tetrahedral atoms, which has extremely low coefficient of thermal expansion. CaAl4O7is also an appealing host for spectroscopic materials due to its strong optical transparency and chemical stability in the ultra-violet to near-infrared spectral region. As a dopant for optical amplifiers, display phosphors, electroluminescence devices, and optical storage phosphors, the Eu3+ ion has gotten a lot of interest [4]. Only a few investigations on rare earth doped CaAl4O7 phosphor have been done so far. It was previously reported on the luminous properties of CaAl4O7 phosphor activated with Pr3+, Ce3+, and Tb3+ and produced via solid state process [5–9].
Therefore, in this work CaAl4O7:Eu0.00, Eu3+doped Ca0.97Al4O7: Eu0.03 and Ca0.87Q0.10Al4O7: Eu0.03(Q= Mg, Sr) phosphors were prepared by a urea fuel combustion method at much lower temperature (500oC). The variation in electric-dipole transitions of Eu3+-ion doped Ca1-xAl4O7: Eux via co-doping of transition metal ion was first time studied for this host. The prepared phosphor samples were studied for the structural, optical, morphological, Photoluminescence (PL) properties.
Experimental details
Synthesis Method
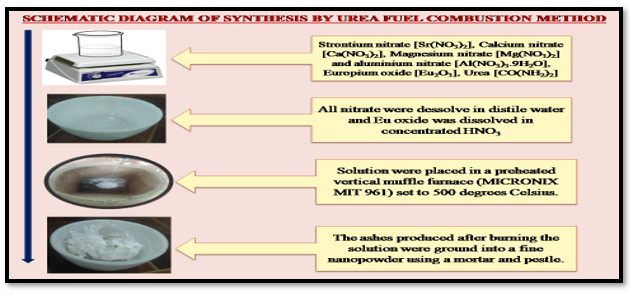
Using the urea fuel combustion method, the CaAl4O7:Eu0.00, Eu3+doped Ca0.97Al4O7: Eu0.03 and Ca0.87Q0.10 Al4O7:Eu0.03 (Q= Mg, Sr) phosphors were produced. Nitrates such as Strontium nitrate [Sr (NO3)2], Calcium nitrate [Ca (NO3)2], Magnesium nitrate [Mg (NO3)2] and aluminum nitrate [Al (NO3)3.9H2O], oxides such as europium oxide [Eu2O3], Urea [CO (NH2)2] and HNO3 (1.4 g/mL) were used as starting ingredients in the synthesis technique. As a reducer and fuel, a certain amount of urea was used. According to the stoichiometry, the powders were weighted. The nitrates and urea were dissolved in enough deionized water to make a transparent solution, then Eu oxide was dissolved in concentrated HNO3, then the two solutions were mixed and agitated for 1 hour at 50 degrees Celsius. The procedure is depicted in Fig.1 as a schematic diagram.
Eu2 O3+ 6HNO3→ 2Eu (NO3) 3+3H2 O (Eq. 1)
After stirring, the precursor solution was transferred to a crucible and placed in a preheated vertical muffle furnace (MICRONIX MIT 961) set to 500 degrees Celsius. The combination is first cooked and dehydrated, followed by decomposition and the release of a huge number of gases containing the oxides of carbon, nitrogen, and ammonia. The reaction is very exothermic, which after sometimes results in spontaneous ignition. Smoldering combustion with tremendous swelling produced white frothy and copious ash from the solution. The vapour phase oxides are converted to mixed aluminates at flame temperatures of 1700-1800 oC. The flame lasts between 80 and 120 seconds. After then, the crucible is removed from the furnace and left to cool at room temperature [10]. The whole process was over within less than 5 min, and obtains the final CaAl4O7: Eu0.00, Eu3+doped Ca0.97Al4O7: Eu0.03 and Ca0.87Q0.10Al4O7: Eu0.03 (Q= Mg, Sr) phosphors.
The synthesized samples and their parameters are listed in Table 1. The chemical reaction of these reactants is shown in Eq. 2, Eq.3, Eq.4 and Eq.5 which is for the Eu3+ doped Ca1-xAl4O7: Eux phosphor synthesized with the urea fuel combustion method as shown in Fig. 1.
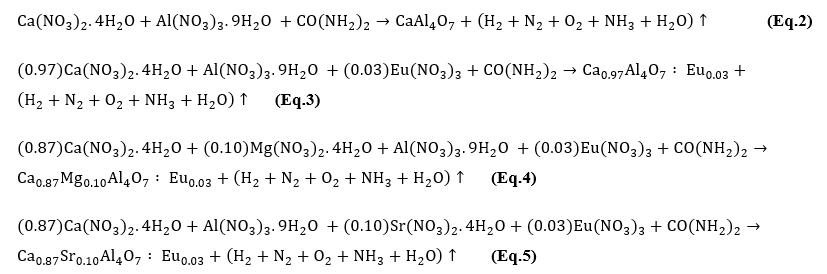
Table 1: The various samples and their sample codes for CaAl4O7:Eu0.00, Eu3+doped Ca0.97Al4O7: Eu0.03 and Ca0.87Q0.10Al4O7: Eu0.03 (Q= Mg, Sr) phosphors prepared by urea fuel combustion method.
| S.N. |
Samples |
Sample Code |
Combustion Temperature (oC) |
| 1 |
CaAl4O7: Eu0.00 |
CA pure |
500 |
| 2 |
Ca0.97Al4O7: Eu0.03 |
CAE 0.03 |
500 |
| 3 |
Ca0.87Mg0.10Al4O7: Eu0.03 |
CMAE 0.03 |
500 |
| 4 |
Ca0.87Sr0.10Al4O7: Eu0.03 |
CSAE 0.03 |
500 |
Figure 1: Schematic diagram for Combustion synthesis method.
Characterization Techniques
The crystalline phase purity of CaAl4O7:Eu0.00 (CA pure), Eu3+ doped Ca0.97Al4O7: Eu0.03 (CAE 0.03) and Ca0.87Q0.10Al4O7: Eu0.03 (Q= Mg, Sr) (CMAE 0.03 & CSAE 0.03) phosphors were characterized by X-ray diffraction pattern; it was obtained using Bruker D8 Advance X-ray diffractometer with CuKα (1.5406Å) radiation. The diffraction pattern was recorded between 10° and 70° (2θ) by using step size at 0.02680 and Estimated Scan Time of 3832 sec/step during the XRD measurement. The crystal structure was drawn by using Vesta software. The surface morphology of samples was studied using a scanning electron microscope (SEM, NOVA NANOSEM 450). Energy dispersive X-ray (EDX) spectrometer (Oxford- EDX system INCA 250 EDS coupled with SEM, NOVASEM 450) was used for the verification of elemental composition. Transmission electron micrograph (TEM) images were obtained by using TEM-TECNAI G2 T30 (S-TWIN) electron microscope having voltage range of 100-400 kV. Which is used for measurement of the particle crystal picture, HRTEM image, and selected area electron diffraction (SAED) image, Crystal structure, voids, pores, particle size defect, and other characteristics of CA pure, CAE 0.03, CMAE 0.03 and CSAE 0.03 phosphor. The chemical bonding behaviors of samples were analyzed by Fourier transform infrared spectroscopy (FTIR -6300 spectrometer equipped with NRS-3300 laser, Jasco, Japan). The optical characterization was done by using UV–VISIBLE spectrophotometer (Lab India Analytical UV3092) and the photoluminescence (PL) was recorded on Spectro fluorophotometer (Horiba scientific Instrument Fluoromax-4 spectrofluorometer) with a spectral slit width of 1.0 nm using a 450 W xenon arc lamp as an exciting source.
Results and Discussion
X-Ray diffraction (XRD) Analysis
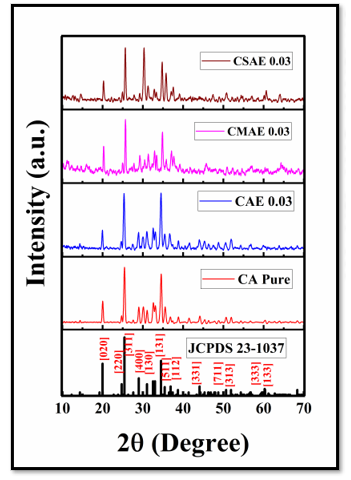
The synthesized samples' diffraction peaks are highly matched to the reference JCPDS Card no. 23-1037, as shown in Fig. 2. The lattice planes of the monoclinic phase (a=12.88, b= 8.88, c= 5.44, α = γ = 90o, β = 106.93o) with space group C 12/c1 are nicely notated as [020], [220], [311], [400], [130], [131], [511], [112], [331], [711], [313], [333], and [133] in the XRD. The single-phase character of the constructed sample was given by the data obtained in the angular range of 10o to 70o shown in Fig. 2.
The Eu3+ ions were unquestionably integrated into the host crystal lattice because the Eu3+-doped Ca1-xAl4O7: Eux samples offered indistinguishable diffraction patterns identical to host. The characterization peak's intensity indicates that the sample is crystalline, while the peaks' breadth shows that the sample has smaller average crystal sizes [11].
Figure 2: XRD spectrum of CA pure, CAE 0.03, CMAE 0.03 and CSAE 0.03 phosphors and standard spectrum JCPDS 23-1037 card.
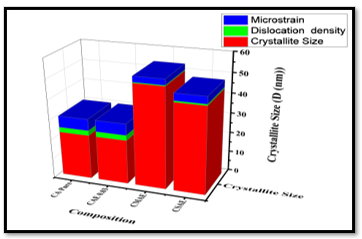
The Crystallite Size (D)[12], Dislocation density (δ)[13], Micro strain (ε) and inter-planner spacing (d) [14] are calculated using these formulas.
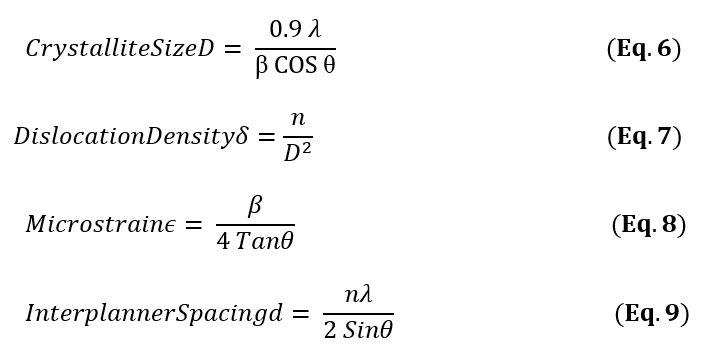
Where, n equals to unity, giving a minimum dislocation density and D is the crystallite size, λ is the wavelength of the occurrence X-beams, θ is the Bragg’s diffraction angle and β is the full width of the diffraction line at half greatest force (FWHM), in radians, radian and using a shape factor (K) of 0.9. The values of crystallite sizes (D), Dislocation density (δ), Micro strain (ε) and inter-planner spacing (d) for CA pure, CAE 0.03, CMAE 0.03 and CSAE 0.03 phosphors are given in Table 2.
Table 2: Structural Parameters- crystallite size D (nm), Dislocation density, micro strain and Inter-planner spacing d (nm) of CaAl4O7:Eu0.00 (CA pure), Eu3+-doped Ca0.97Al4O7: Eu0.03 (CAE 0.03) and Ca0.87Q0.10Al4O7: Eu0.03 (Q= Mg, Sr) (CMAE 0.03 & CSAE 0.03) phosphors.
| S.N. |
Composition |
Crystallite Size |
Dislocation density |
Microstrain |
d SPACING |
|
|
|
D (nm) |
δ × 10-3 (nm-2) |
ε × 10-3 |
(nm) |
| 1 |
CA Pure |
22.3537 | 2.5202 | 5.7189 | 0.2659 |
| 2 |
CAE 0.03 |
22.2748 | 2.6350 | 5.6608 | 0.2605 |
| 3 |
CMAE 0.03 |
50.52 | 0.41 | 2.86 | 0.32 |
| 4 |
CSAE 0.03 |
43.64 | 0.70 | 3.55 | 0.30 |
Table 3: Structural Parameters- Peak Position (2θ), Miller indices (hkl), crystallite size D (nm), Dislocation density, Microstrain and Inter-planner spacing d (nm) of CSAE 0.03 phosphors.
|
(hkl) |
Peak |
FWHM |
d Spacing |
Crystallite Size |
Dislocation density |
Microstrain |
|
|
(2 θ°) |
(β°) |
(nm) |
D (nm) |
δ × 10-3 (nm-2) |
ε × 10-3 |
|
(020) |
20.228 | 0.168 | 0.438 | 47.914 | 0.435 | 4.119 |
|
(311) |
25.627 | 0.224 | 0.347 | 36.306 | 0.758 | 4.304 |
|
(400) |
30.290 | 0.297 | 0.294 | 27.632 | 1.309 | 4.801 |
|
(131) |
34.784 | 0.238 | 0.257 | 34.915 | 0.820 | 3.321 |
|
(711) |
47.369 | 0.121 | 0.191 | 71.475 | 0.195 | 1.207 |
From the Table 2 it is observed that when we doped transition metal ion in our host, the dislocation density and micro-strain decrease with increase in crystallite size, as shown in Fig.3, which indicates a lower number of lattice imperfections, and decrease in the occurrence of grain boundaries because of an increase in the crystallite size of the particle. The structural parameters for CSAE 0.03 phosphor are shown in Table 3.
Figure 3: Variation of Dislocation Density, Micro strain and Crystallite Size with Concentration of CA pure, CAE 0.03, CMAE 0.03 and CSAE 0.03 phosphors.
Scanning electron microscopy (SEM), SEM mapping and EDX analysis
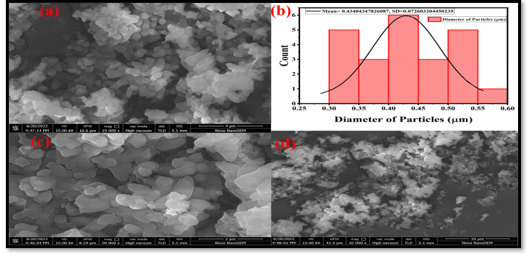
The SEM is widely known as a significant scientific technique for characterization because it can provide high resolution images of objects. Details about morphological changes, changes in grain size and shape, etc., are provided. SEM can also be used to determine the micro fabric and crystallographic orientation of the tested sample. The SEM pattern of synthesized phosphor is shown in Fig.4 (a), (c) and (d). Fig.4 (b) shows the typical plot indicating the distribution of nanoparticles. The morphological images of the samples have irregular shapes and exhibit poor particle aggregation. The high temperature at which the samples are created may be what causes such an aggregation. As synthesis temperature changes, the surface shape changes as well. The sample exhibits large and spherical grains in terms of size, and surface morphology exhibits more roughness at the lower temperature. The surface roughness and grain size are less at the higher temperature. In other words, compared to the sample developed at lower temperature, the grain size and surface roughness decrease as the temperature rises. It shows how the sample's structural quality and crystalline orientation are enhanced by the temperature increase. At a very high temperature, agglomeration happens as the samples are being synthesized. High synthesis temperatures cause particles to close together and atomic forces to weaken when atomic bonds begin to disintegrate. It can be determined from these micrographs that the majority of the particles are micrometer-sized, which is again advantageous for their use in the field of solid-state lighting.
Figure 4:Eu3+-doped Ca1-xSr0.10Al4O7:Eux (x= 0.03) phosphor SEM image (a), (c) and (d) Typical plot indicating the distribution of nanoparticles (b).
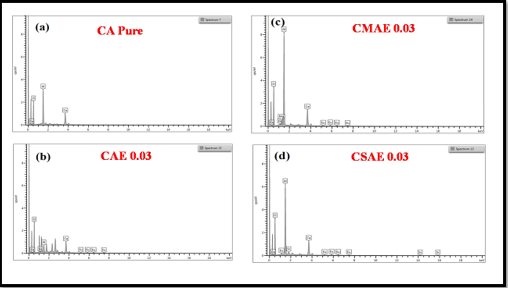
Energy Dispersive X-ray (EDX) spectra can identify the sample's elemental composition and distribution. The EDX spectra of the CaAl4O7:Eu0.00 (CA pure), Eu3+doped Ca0.97Al4O7: Eu0.03 (CAE 0.03) and Ca0.87Q0.10Al4O7: Eu0.03 (Q= Mg, Sr) (CMAE 0.03 & CSAE 0.03) phosphors samples are shown in Fig.5 (a), (b), (c) & (d) respectively. This is done in order to determine the composition of the sample. It is evident from the EDX spectra that the phosphors' primary components are calcium (Ca), magnesium (Mg), strontium (Sr), aluminium (Al), europium (Eu), and oxygen (O). Quantitative EDX analysis reveals that while the percentage contribution of the other elements remained unchanged, the concentration of Ca decreased as a result of the rise in dopant Eu3+ and transition metal, which is in good agreement with the stoichiometry calculated theoretically. The presence of the elements in the synthesized phosphor is confirmed by the principal peaks seen in the EDX spectra.
Figure 5: Typical EDX spectra of CA pure (a), CAE 0.03 (b), CMAE 0.03 (c) and CSAE 0.03 (d) phosphors.
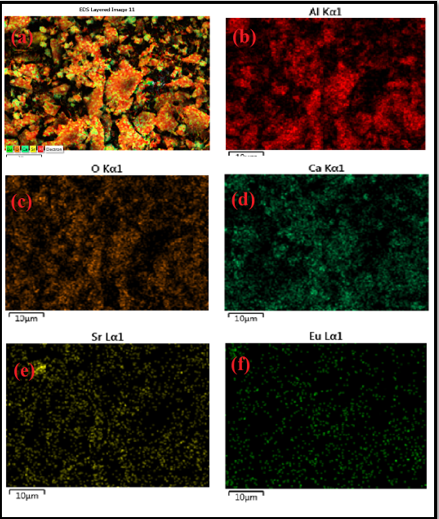
The typical EDX mapping images of Ca0.87Q0.10Al4O7: Eu0.03 (CSAE 0.03) phosphors are shown in Fig.6(a)-(e) respectively. The EDX mappings show the homogeneous distribution of nano particles in crystal structure.
Figure 6: (a)-(f) Typical EDX mapping images of Eu3+doped Ca0.87Q0.10Al4O7: Eu0.03 (CSAE 0.03) phosphor material.
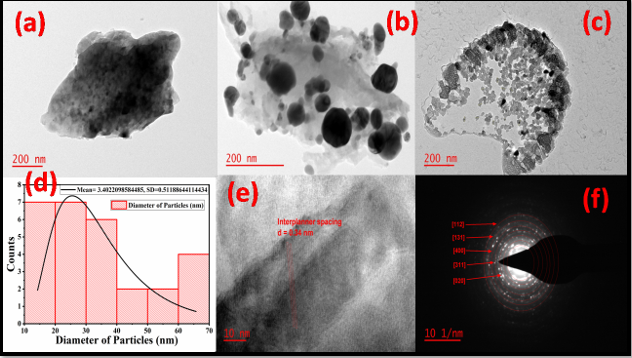
An identifies the attributes for analyzing information on the crystal structure, particle size, flaws, imperfections, voids, and pores is transmission electron microscopy (TEM). Transmission electron microscopy was used to measure the particle crystal morphology, HRTEM image and the selected area electron diffraction (SAED) image for the sample CSAE 0.03, as shown in Fig. 7 (a)-(e). The TEM images of an average crystal size makes it abundantly evident that the majority of the particles are found in clusters with an average particle size of 30–80 nm as shown in Fig. 7 (a) –(c). The predicted diameter of particles in the nanometer range is shown in Fig. 7 (d). Due to the synthesis procedure, the cluster of powder particles is also visible. As a result of the exothermic reaction of combustion, smaller crystal grains with irregular sizes ranging from 2 to 10 nm have been reported inside larger particles (100nm-1 µm). These differences were discovered when the samples were heated to a high temperature in a reducing atmosphere after the combustion reaction. The TEM image's selected area electron diffraction (SAED) pattern, which has occupied diffuse circular diffraction, rings. As shown in Fig.7 (f), the SAED pattern results (Table.4) of the sample are exactly equivalent to the XRD pattern results (Table.3), which are [020], [311], [400], and [221] accordingly. The high-resolution image that displays HR lattice fringes is shown in Fig. 7 (e). We have calculated the inter planner spacing between two lattice fringes using the Bragg formula; the calculated inter planner spacing d = 0.34 nm by using TEM data and the observed inter planner spacing d = 0.35 nm for [311] plane (Table 3) from XRD results are highly compatible with the Eu3+doped Ca1-xSr0.10Al4O7:Eux (x= 0.03) (CSAE 0.03) phosphor.As a result, we came to the conclusion that the SAED and HR-TEM images show that the synthesized CSAE 0.03 sample's crystalline size is constructed as a nano particle and exhibits high quality crystalline properties.
Table 4: Inter-planner spacing (d spacing) calculated from TEM image's selected area electron diffraction (SAED) pattern for Eu3+doped Ca1-xSr0.10Al4O7:Eux (x= 0.03) phosphor (CSAE 0.03).
| S.N. |
1/D or 1/2r (nm-1) |
1/r (nm-1) |
r (nm) |
d Spacing |
(h,k,l) |
| 1 | 11.521 | 23.042 | 0.043399 | 0.43399 |
[020] |
| 2 | 13.906 | 27.812 | 0.035956 | 0.359557 |
[311] |
| 3 | 16.091 | 32.182 | 0.031073 | 0.310733 |
[400] |
| 4 | 18.323 | 36.646 | 0.027288 | 0.272881 |
[221] |
Figure 7: Eu3+doped Ca1-xSr0.10Al4O7: Eux (x= 0.03) phosphor (CSAE0.03) TEM image (a), (b), (c), Typical plot indicating the distribution of nanoparticles (d), HRTEM image (e) and SAED pattern (f).
FTIR Analysis
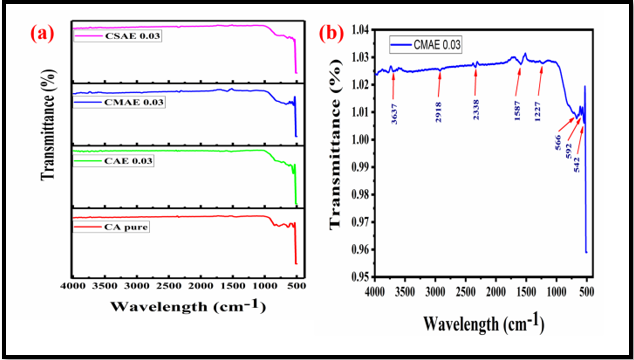
The physical characteristics of inorganic substances are represented by their infrared spectrum. For the investigation of both organic and inorganic substances, the middle part of the spectrum (4000–400 cm–1) is quite helpful. Fig.8 displays the FTIR spectra of the CaAl4O7: Eu0.00 (CA pure), Eu3+doped Ca0.97Al4O7: Eu0.03 (CAE 0.03) and Ca0.87Q0.10Al4O7: Eu0.03 (Q= Mg, Sr) (CMAE 0.03 & CSAE 0.03) phosphors that have been doped with Eu3+. Due to moisture in the atmosphere, the weak band centered at 3634 cm-1 can be attributed to the vibration mode of chemically linked hydroxyl groups[15]. The band at 2054-1982 cm-1, which is attributed to vibrations of the H-O structure, may offer proof of the presence of molecular water in the structure. The vibration band in the CAOE samples is focused at 542, 592, 566, 638, and 1227, 1587 cm-1. Due to the presence of nitrates, it is notable that there is no band around 1387 cm-1.[16,17] According to reports, nano phosphor produced by the combustion of urea fuel contains nitrates. The nitrate, organic impurities, and evaporated water molecules are totally eliminated after 5 hours of annealing at 900 oC. In our synthesis method, the furnace was kept at 500 oC, and combustion took place to produce an exothermic reaction and raise the reaction temperature to above 1800 oC. As a result, at high temperature, nitrates and other organic products are removed from the final phosphor, and our process didn't require any post-thermal treatment. It's also in good agreement with the X-ray diffraction results for the crystalline CaAl4O7: Eu0.00 (CA pure), Eu3+doped Ca0.97Al4O7: Eu0.03 (CAE 0.03) and Ca0.87Q0.10Al4O7:Eu0.03 (Q= Mg, Sr) (CMAE 0.03 & CSAE 0.03) phosphors material that the sharp peaks between 510 cm-1 and 600 cm-1 are caused by the stretching or rotating mode of Ca-Al-O in monoclinic lattice coordinate.
Figure 8: FTIR spectrum of. CaAl4O7:Eu0.00, Eu3+doped Ca0.97Al4O7: Eu0.03 and Ca0.87Q0.10Al4O7: Eu0.03 (Q= Mg, Sr) phosphors (a) and CMAE (b).
UV- VISIBLE Analysis
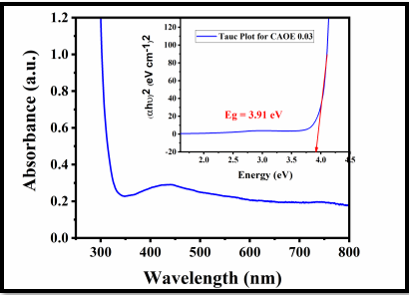
The study of optical absorption is an important characteristic for understanding the behavior of nano phosphor. The energy difference between the filled valence band and the empty conduction band, known as the band gap, is a fundamental characteristic. An abrupt increase in absorption at the wavelength corresponding to the band gap energy results from optical excitation of electrons across the band gap, which is strongly permitted. The optical absorption edge is the name given to this aspect of the optical spectrum. The optical absorption spectra of the 200-800nm-bandwidth Eu3+doped Ca1-xAl4O7: Eux (x= 0.03) (CAE 0.03) phosphor material is shown in Fig.9. It is evident from Fig.9 that no absorption occurs for wavelengths less than 310nm.
The Kubelka-Munk function was used to calculate the band gap [18]. In the parabolic band structure, we are aware of the Tauc link between Eg and the absorption coefficient [19]. For a direct band gap material, the Tauc relation is
![]() (10)
(10)
Where symbols have their usual meaning, the power of the bracket n is taken to be equal to 1/2 for direct band gap materials. Inferring from the fact that the kubelka munk function is proportional to the absorption coefficient and that the scattering coefficient is assumed to be constant with respect to wavelength and applied to the above equation, we obtain the following relationship:
![]() (11)
(11)
The (αhυ) 2 vs. hυ graph is shown in Fig. 9 (inset figure). The optical band gap for the Eu3+doped Ca1-xAl4O7: Eux (x= 0.03) (CAE 0.03) phosphor material is calculated by extrapolating a straight line along the sharp edge of the curve intercepts the energy axis at a point which gives the estimated value of band gap and is 3.91eV.
Figure 9: UV- Visible spectrum and Tauc Plot for Eu3+doped Ca1-x Al4O7: Eux (x= 00.03) (CAE 0.03 phosphor).
Photoluminescence Analysis
The Excitation and emission spectra are measured using a Horiba scientific Instrument Fluoromax-4 spectroflurometer fitted with a 450 W xenon arc lamp as the light source at room temperature in order to explore the photoluminescence (PL) characteristics of the manufactured phosphor. The PL excitation spectra of the sample are measured by observing the emission at 610 nm wavelength attributed to transition 5D0→7F2 [20]. The excitation spectra of CaAl4O7:Eu0.00 (CA pure), Eu3+doped Ca0.97Al4O7: Eu0.03 (CAE 0.03) and Ca0.87Q0.10Al4O7: Eu0.03 (Q= Mg, Sr) (CMAE 0.03 & CSAE 0.03) phosphors are shown in Fig. 10(a). Fig 10(b). shows the charge transfer (CT) band for host material.
Figure10: PL Excitation spectrum of CaAl4O7:Eu0.00 (CA pure), Eu3+doped Ca0.97Al4O7: Eu0.03 (CAE 0.03) and Ca0.87Q0.10Al4O7: Eu0.03 (Q= Mg, Sr) (CMAE 0.03 & CSAE 0.03) phosphors(a), Charge Transfer (CT) band for host CaAl4O7 (b).
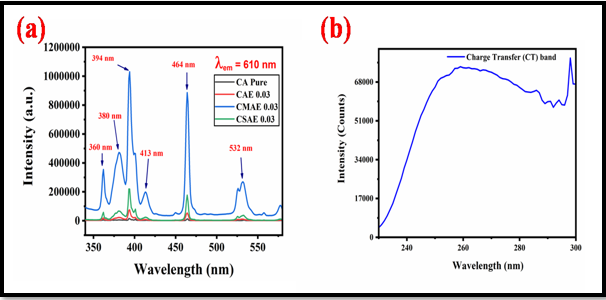
The excitation spectra were captured between the wavelengths of 325nm and 600nm. Five peaks were found, as shown in Fig. 10, at wavelengths of 360 nm, 380 nm, 394 nm, 413 nm, 464nm and 532 nm. The transition 7F0→5L6 is responsible for the largest intensity peak, which is seen at 394 nm[21]. According to the strongest peak, which is at 394 nm, phosphor is appropriate for UV LED chips and other optoelectronic devices.
Table 5: Excitation Wavelength and Energy Band gap for CaAl4O7: Eu0.00 (CA pure), Eu3+doped Ca0.97Al4O7: Eu0.03 (CAE 0.03) and Ca0.87Q0.10Al4O7:Eu0.03 (Q= Mg, Sr) (CMAE 0.03 & CSAE 0.03) phosphors.
|
Excitation Wavelength (nm) |
360 |
380 |
394 |
413 |
464 |
532 |
|
Energy band gap (eV)
|
3.44 | 3.26 | 3.14 | 3.09 | 2.99 | 2.33 |
The energy band gap calculated by using photoluminescence excitation data is shown in Table.5, the high intensity peak cantered at 394 nm has energy band gap value 3.14 eV, which is highly matched with optical band gap, 3.91 eV calculated by using UV-VISIBLE spectroscopy (Fig.9) for Eu3+doped Ca1-xAl4O7 :Eux (x= 0.03) (CAE 0.03) phosphor.
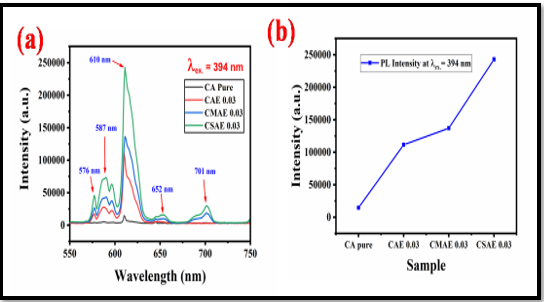
We prepared a series of CaAl4O7:Eu0.00 (CA pure), Eu3+doped Ca0.97Al4O7: Eu0.03 (CAE 0.03) and Ca0.87Q0.10Al4O7: Eu0.03 (Q= Mg, Sr) (CMAE 0.03 & CSAE 0.03) phosphors and analyzed their emission spectra in order to determine the optimal transition metal for doping in host lattice. The emission spectra is shown in Fig.11(a). The 394 nm wavelength excites the PL emission spectra of Ca1-xAl4O7:Eux. The emission spectra have five emission peaks, which are located at 576, 587, 610, 652 and 701 nm. The stronger peak at 610nm wavelength is attributed to the electric dipole transition, whereas the weaker peaks at 576nm, 587 nm, 652nm and 701nm wavelength are caused by the magnetic dipole transition [22]. When the transition (Mg, Sr) metal is doped in Eu3+doped Ca0.97Al4O7: Eu0.03 phosphor then the emission intensity of sample increase as shown in Fig 11(b).
Figure 11: PL Emission spectra of CaAl4O7:Eu0.00, Eu3+doped Ca0.97Al4O7: Eu0.03 and Ca0.87Q0.10Al4O7: Eu0.03 (Q= Mg, Sr) phosphors.
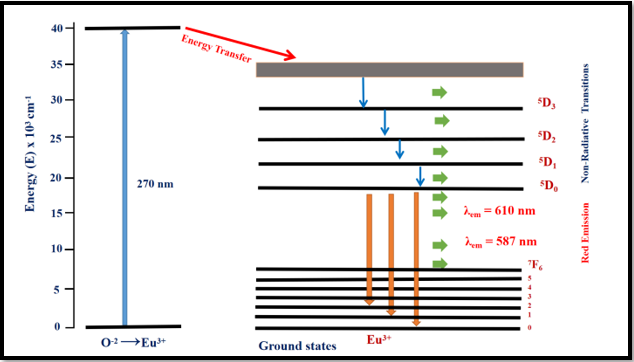
A model illustrating the role of energy states in the Ca1-xAl4O7:Eux phosphor's photoluminescence excitation and emission process is shown in Fig. 12. In this model, the activator is the first ions (Eu3+) excited from the ground state to the singlet state in the 5Dj= 3,2,1,0 configuration, and the electrons are then transferred to the triplet state, essentially to state 4, because of symmetry considerations. In comparison to other luminous processes, the shift to the final state 5D0 occurs extremely instantly.
It implies that the presence of singlet state has no impact on the luminescent process [23]. Most frequently found in emission spectra are the transitions 5D0→7F2 at 610 nm wavelength and 5D0→7F2 at 595 nm wavelength. Large color purity is primarily attributed to the red emission's high contribution (610 nm) and the orange emission's low intensity (587 nm), which are sufficient for light-emitting phosphor [24]. The Ca0.87Q0.10Al4O7: Eu0.03 (Q= Mg, Sr) phosphor shows potential application for light emitting diode because of its effective excitation at 394nm.
Figure12: Energy level diagram showing light emission process from phosphor.
The decay curves for various samples were measured (λex. = 394nm, λem. = 610nm) which are shown in Fig.13, the decay curves are well fitted by using double exponential decay function according to Eq. (12), where I(t), t, A1, A2, τ1, and τ2 are the PL intensity, time, fitting constants and decay time for exponential component, respectively. The average age lifetime (tav.) has been calculated by Eq. (13)
![]() (12)
(12)
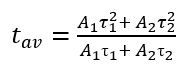 (13)
(13)
Based on Eq. (13), the luminescence lifetimes of CaAl4O7:Eu0.00 (CA pure), Eu3+doped Ca0.97Al4O7: Eu0.03 (CAE 0.03) and Ca0.87Q0.10Al4O7: Eu0.03 (Q= Mg, Sr) (CMAE 0.03 & CSAE 0.03) phosphors have been determined and are shown in Table.6.
Figure13: Typical Photoluminescence decay result for CaAl4O7:Eu0.00(CA pure), Eu3+doped Ca0.97Al4O7: Eu0.03 (CAE 0.03) and Ca0.87Q0.10Al4O7: Eu0.03 (Q= Mg, Sr) (CMAE 0.03 & CSAE 0.03) phosphors.
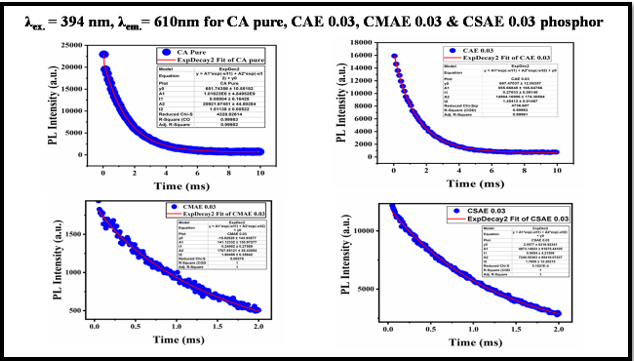
From XRD analysis it can be seen that crystallite size of Mg2+ doped sample is more compared to another sample. Since the highest crystallite size represents ordered structure and reduction of energy trapping defect centers. However here observed lifetime tau is high for CMAE 0.03 opposite to expectations which should high be for CSAE 0.03. The lifetime tau is inversely proportional to radiative and non-radiative transition. For Mg doped sample crystallite size high so non-radiative transition rate decreases than total transition rate decreases. Since lifetime is inversely proportional to total transition rate so it is increases. CSAE 0.03 lifetime decreases because it’s less crystallite size cause slight increase in radiative as well as non-radiative transition so that lifetime slightly decreases.
Table 6: Typical photoluminescence (PL) exponential components CaAl4O7:Eu0.00 (CA pure), Eu3+doped Ca0.97Al4O7: Eu0.03 (CAE 0.03) and Ca0.87Q0.10Al4O7: Eu0.03 (Q= Mg, Sr) (CMAE 0.03 & CSAE 0.03) phosphors.
| S.N | Sample code | R2 value | |
A1 | A2 | ||
| 1 | CA pure | 0.99983 | 0.00804 | 1.51138 | 1.01623E6 | 20921.67451 | 1.2026 |
| 2 | CAE 0.03 | 0.99963 | 0.27633 | 1.45412 | 855.66848 | 14984.16906 | 1.4414 |
| 3 | CMAE 0.03 | 1 | 0.24882 | 1.60498 | 141.12332 | 1767.85121 | 1.5884 |
| 4 | CSAE 0.03 | 1 | 0.9054 | 1.7659 | 4873.14023 | 7240.5503 | 1.5451 |
For Visual understanding of the color- tunable emission and the chromaticity properties the Commission Internationale de l′Eclairage (CIE) diagram has also been used. The CIE diagrams are shown in Fig 14.
Figure14: (a) PL CIE diagram of CaAl4O7:Eu0.00 (b) Eu3+doped Ca0.97Al4O7: Eu0.03 (c) Ca0.87Mg0.10Al4O7: Eu0.03 (CMAE 0.03) and (d) Ca0.87Sr0.10Al4O7: Eu0.03 (CSAE 0.03) phosphors.
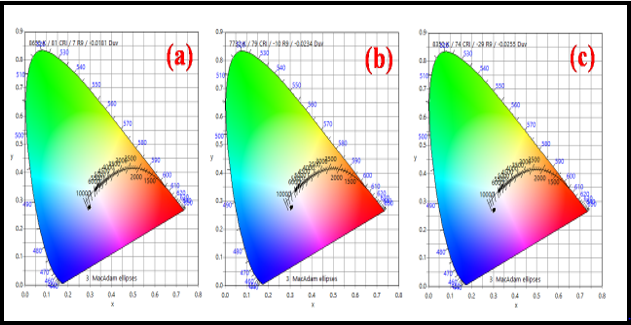
Each solid-state lighting product has a distinct CCT attribute that represents the color temperature of white light. Additionally, it describes the source of the light and how warm or cold the light it emits is. The CCT value is high in the cool region and low in the warm region. However, it indicated the cool region if the CCT value of the light source was greater than 4000K. The color correlated temperature (CCT) is computed using McCamy empirical[25] formula, which is given in Eq. (14).
![]() (14)
(14)
Where ![]() is the reciprocal of slope line, (x,y) are the computed CIE coordinates of Sr1-x Al2O4 :Eux phosphor and xe = 0.3320, ye = 0.1858 is the epicenter. The calculated CCT values of the synthesized phosphor are presented in Table.7.
is the reciprocal of slope line, (x,y) are the computed CIE coordinates of Sr1-x Al2O4 :Eux phosphor and xe = 0.3320, ye = 0.1858 is the epicenter. The calculated CCT values of the synthesized phosphor are presented in Table.7.
The importance of the light source's spectrum is described by the associated color rendering index (CRI). It is an important parameter to define how well the spectrum of the light source is composed. An excellent quality light source has a CRI range from 75 to 100, a good quality source of light has CRI range from 56 to 75, a fair quality source of light has CRI range from 55 to 65, and a poor-quality source of light has CRI range from 0 to 55 are observed [26]. In this work, we have calculated the CRI value by Eq. (15)
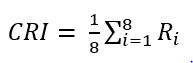 (15)
(15)
The concept and calculation of color rendering index (Ri) are already reported by Ghosh et al [27]. In this work, calculated CRI values vary from 37 to 87 which indicates prepared phosphor is showing excellent CRI range for orange red color. therefore, it is predicted that the color of the phosphor may be applicable as a architectural firms in offices and hospitals, it may use for fabrication of outdoor lighting etc., because it has a high color index and high CCT value therefore it may be a useful of optoelectronic applications. The luminous efficacy of radiation (LER) is calculated using lumens per visible watt.
Table 7: Composition, CIE Coordinate (x,y), Correlated color temperature (CCT), Color Rendering Index (CRI) and Color purity for CaAl4O7: Eu0.00 , Eu3+doped Ca0.97Al4O7: Eu0.03 and Ca0.87Q0.10Al4O7: Eu0.03 (Q= Mg, Sr) phosphors.
| S.N |
Sample code |
CIE Co-ordinate |
Color Purity (%) |
CRI |
CCT (K) |
LER |
Visible Watt
mW |
Lumens |
|
1 |
CAE 0.03 |
0.2984, 0.2760 | 7.53 |
81 |
8655 |
42.7 |
5482154000 |
234132198 |
|
2 |
CMAE 0.03 |
0.3071 0.2761 | 7.05 |
79 |
7732 |
41.3 |
8280785500 |
342110765 |
|
3 |
CSAE 0.03 |
0.3036, 0.2693 | 8.45 |
74 |
8350 |
29 |
12963773000 |
376473391 |
Conclusion
In this work efficient, high purity and homogeneous Ca0.87Q0.10Al4O7: Eu0.03 (Q= Mg, Sr) phosphors were successfully synthesized by urea fuel Combustion method. The study of electric-dipole transitions of Eu3+doped Ca1-xAl4O7: Eux via co-doping of transition metal ion (Q=Sr & Mg) was done for the first time for this CaAl4O7 host. The phase purity and monoclinic structure of synthesized phosphor are confirmed by the XRD analysis. The SEM and TEM images exhibits aggregation of particles with irregular shape in as synthesized phosphors and particle size is found to be in the range of 30-80 nm. The elemental composition of as synthesized phosphor is confirmed by EDX spectra. The EDX mapping images show that all the activator ions (Eu3+) are homogeneously distributed in crystal lattice. The Symmetric and anti-symmetric stretching between active bands of synthesized phosphor were observed by FTIR spectroscopy. The optical band gap is calculated by UV-VISIBLE spectroscopy and for CSAE 0.03 phosphor the value of optical band gap is 3.91 eV. The photoluminescence spectra were monitored at excitation wavelength 394 nm and it showed strong red emission lines at 610 nm corresponds to the electric dipole transitions 5D0→7F2 transition and orange emission lines at 587 nm corresponding to magnetic dipole 5D0→7F1 transition. The PL spectra shows that by co-doping of transition metal ions in host, it gives highest emission intensity for CSAE 0.003 phosphor. The CCT, CRI and Visible Watt values were also calculated for all the synthesized phosphor and found that Ca0.87Q0.10Al4O7: Eu0.03 (CSAE 0.03) phosphor have optimum and efficient results. Therefore CSAE 0.03 phosphor material would have application in architectural firms in offices and hospitals, it may use for fabrication of outdoor lighting etc., because it has a high color rendering index (CRI) and high CCT value therefore it may be a useful of optoelectronic applications.
Authors' contributions
Material preparation, Conceptualization, Methodology, Formal analysis, Investigation, Writing and editing- original draft, data collection and analysis were performed, and the first draft of the manuscript was written by [Praveen Kumar Litoriya]. Funding acquisition, Conceptualization, Supervision, Project administration, Resources was provided by [Ashish Verma]. All authors read and approved the final manuscript.
Conflicts of interest/Competing interests
The authors declare that they have no known competing financial interests or personal relationships that could have appeared to influence the work reported in this paper.
Funding- Not applicable.
Ethics Declaration statement – Not applicable.
Consent to Participate- Not applicable.
Consent for publication – Not applicable.
Availability of data and material/ Data availability- On behalf of all authors, the corresponding author states that materials described in the manuscript, including all relevant raw data, will be freely available to any researcher wishing to use them for noncommercial purposes, without breaching participant confidentiality. The corresponding author also states that the information on where data supporting the results reported in the article can be found, if applicable. When and where applicable, hyperlinks to publicly archived datasets analyzed or generated during the study.
Acknowledgments
Authors acknowledge Centre for Advanced Research (CAR) of Dr. Harisingh Gour Vishwavidyalaya, Sagar (M.P.) (A Central University) for extending Its characterization facilities. Authors further extend their gratitude to Head, Department of Physics, Dr. Harisingh Gour Vishwavidyalaya, Sagar (M.P.) (A Central University) for PL characterization
References
- J Park, G Kim, Y Jin (2013) Luminescent properties of CaAl4O7 powders doped with Mn 4 þ ions. Ceramics International 39: S623–S626.
- YJ Park, YJ Kim (2008) Blue emission properties of Eu-doped CaAl2O4 phosphors synthesized by a flux method. Materials Science and Engineering B: Solid-State Materials for Advanced Technology 146: 84–88.
- D Weber, A Bischoff (1994) Grossite (CaAl4O7) - a rare phase in terrestrial rocks and meteorites. European Journal of Mineralogy 6: 591–594.
- G Blasse, BC Grabmaier (1994) A General Introduction to Luminescent Materials. Luminescent Materials 1–9.
- D Jia, J Zhu, B Wu, SE (2001) Luminescence and energy transfer in CaAl4O7: Tb3+, Ce3+. Journal of Luminescence 93: 107–114.
- (2022) Structural Interpretation and Photoluminescence Properties of 649–657.
- S Kurmi (2022) A Comparative Analysis on Structural and Photoluminescence Properties of Dysprosium, Neodymium and Europium Doped Strontium 12: 38447–38452.
- (2021) Engineering, M. Engineering, Vidyabharati International Interdisciplinary Research Journal Special Issue 333–342.
- S kurmi, PK Litoriya, A Verma (2021) Synthesis and Optical Characterization of Dysprosium Doped Strontium Calcium Aluminates Based Nanophosphor for Yellow Lighting Application 3069–3075.
- Z Qiu, Y Zhou, M Lu, A Zhang, Q Ma, et al. (2007) Combustion synthesis of long-persistent luminescent MAl2O4: Eu 2+, R 3+ (M = Sr, Ba, Ca, R = Dy, Nd and La) nanoparticles and luminescence mechanism research, 55: 2615–2620.
- AN Yerpude, SJ Dhoble (2011) Combustion synthesis of blue-emitting submicron CaAl4O7: Eu 2+, Dy 3+ persistence phosphor 0–4.
- PK Litoriya, S Kurmi, A Verma (2022) Materials Today: Proceedings Structural, optical, morphological and photoluminescence properties of SrAl2O4: Dy by using urea fuel combustion method. Materials Today: Proceedings 0–5.
- P Shanthraj, MA Zikry (2011) Dislocation density evolution and interactions in crystalline materials. Acta Materialia 59: 7695–7702.
- Y Liu, Y Liu, MGB Drew (2020) Clarifications of concepts concerning interplanar spacing in crystals with reference to recent publications, SN Applied Sciences.
- SK Sao, N Brahme, DP Bisen, G Tiwari (2016) Photoluminescence and thermoluminescence properties of Eu 2 + doped and Eu 2+, Dy 3+ co- doped Ba2 MgSi 2O7 phosphors.
- (1998) Chemical Preparation of the Binary Compounds in the Calcia–Alumina System by Self-Propagating Combustion Synthesis 63: 2853–2863.
- J Guo, H Lou, H Zhao, X Wang, X Zheng, et al. (2004) Novel synthesis of high surface area MgAl2O4 spinel as catalyst support 58: 1920–1923.
- T Tauc, P Kubelka, F Munk, S Information, T Tauc, et al. (2018) How to Correctly Determine the Band Gap Energy of Modi fi ed Semiconductor Photocatalysts Based on UV − Vis Spectra 8–11.
- A Verma, A Verma, G V Bramhe, IP Sahu (2018) Optical studies of the Ba1-xMgAl10O17: Eux phosphors synthesis by combustion route, Journal of Alloys and Compounds.
- SS Babu, P Babu, CK Jayasankar, W Sievers, T Tro, et al. (2007) Optical absorption and photoluminescence studies of Eu3+-doped phosphate and fluorophosphate glasses 126: 109–120.
- M Puchalska, Y Gerasymchuk, E Zych (2010) Optical properties of Eu 3+ -doped CaAl4O7 synthesized by the Pechini method. Optical Materials 32: 1117–1122.
- B Tsai, Y Chang, Y Chen (2004) Nanostructured red-emitting MgGa2O4: Eu3+ phosphors 3–7.
- AU Pawar, AP Jadhav, U Pal, B Kyu, Y Soo, et al. (2012) Blue and red dual emission nanophosphor CaMgSi2O6: Eu n þ; crystal structure and electronic configuration. Journal of Luminescence 132: 659–664.
- B Verma, RN Baghel, DP Bisen, N Brahme, A Khare, et al. (2020) Synthesis and concentration dependent luminescent characterization of BaMgSiO4: Eu3+ phosphor, Journal of Alloys and Compounds.
- GR Banjare, DP Bisen, N Brahme, C Belodhiya (2020) Synthesis and luminescence behavior of Ba2SiO4: Dy3+ phosphors in presence of charge compensatory ions phosphors in presence of charge compensatory ions.
- A Verma, DP Bisen, S Nema, IP Sahu, T Ray, et al. (2022) Investigation of structural, luminescence, and anti- bacterial properties of novel Zn 12 x Eu x Al 2 2 y O 4 Sr y phosphor.
- A Ghosh, P Selvaraj, S Sundaram, TK Mallick (2018) The color rendering index and correlated color temperature of dye-sensitized solar cells for adaptive glazing application. Solar Energy 163: 537–544.
- Abstract
- Keywords
- Introduction
- Experimental details
- Characterization Techniques
- Results and Discussion
- Scanning electron microscopy (SEM), SEM mapping and EDX analysis
- FTIR Analysis
- UV- VISIBLE Analysis
- Conclusion
- Authors' contributions
- Conflicts of interest/Competing interests
- Acknowledgments
- References