Some Peculiarities of Isotope - Based Materials
V G Plekhanov1*
1 Head, Laboratory of Applied Nanotechnology of Belousov Pr. Nauky, 31-v, fl. 32 Kharkov, 61072, Ukraine.
*Corresponding Author:V.G. Plekhanov, Fonoriton Science Lab, Garon ltd, Tallinn, 11413, Estonia, Tel: +3726416555; Fax: +3726416555; E-mail:vgplekhanov@gmail.com
Citation: VG Plekhanov (2023) Some Peculiarities of Isotope - Based Materials. Nano Technol & Nano Sci J 5: 151.
Received: April 20, 2023; Accepted: April 30, 2023; Published: May 8, 2023.
Abstract
Most of the physical properties of substances depend on a greater or lesser isotopic composition. 95% or more of substances are mixture of different isotopes. We analyze and overview the main characteristics of the new isotope - based materials. Mainly the results of isotope - substituted substances based on lithium hydride and carbon are used. LiH has the largest isotopic shift. Carbon, being the second element after silicon on Earth, has an unusually wide range of allotropic compounds with completely different physical properties. The use of our object allows the investigation of not only the isotope effects in lattice dynamics (vibrational, elastic and thermal properties), but also the influence of such effects on the electronic excitations (for example, the renormalization of the band - to - band transition energy Eg). We emphasize that the study of the isotope effect remains at the forefront not only in materials science, but also nuclear and high energy physics. The latter one is associated with the non - accelerating manifestation of strong nuclear interaction as well as the origin of mass inNature.
Keywords
Keywords:Spectroscopy, Luminescence, Carbon Materials, Electronic Materials
Introduction
Materials are important to mankind because of the benefits that can be derived from the manipulation of their properties. Examples include electrical conductivity, dielectric constant, magnetization, optical transmittance, strength and toughness. All of these properties originate from the internal structures of the materials. Structural features of materials include their types of atoms, the local configurations of the atoms, and the arrangements of these configurations into microstructures.
Materials can be divided into various classes which may constitute separate fields such as metals, polymers, ceramics, composites, semiconductors, biomaterials and nanomaterials. Materials science is a broad field and can be considered to be an interdisciplinary area. Included within it are the studies of the structure and properties of any material, the creation of new types of materials, and the manipulation of a material’s properties to suit the needs of specific application.
The basis of materials science involves relating the desired properties and relative performance of a material in a certain application to the structure of the atoms and phases in that material through characterization. Physical properties of materials usually play an important role in the selection of material for a particular application. This involves many factors such as material composition and structure, fracture and stress analysis, conductivity, optical, and thermal properties, to name a few. It also involves design, modeling, simulation, processing, and production methods. Research in the field of materials science involves many peripheral areas including crystallography, microscopy, lithography, mineralogy, photonics, and powder diffraction.
Successful studies of the last five decades of the isotopic effect in solids [1, 2] have made it possible to create a new branch of classical materials science - isotopic materials science [3]. Here, the new degree of freedom is the isotopic composition of the mass of the particles forming the material. The latter causes a global change in the properties of the material - direct measurement of the microscopical characteristics of electron excitations [2], phonons and their interactions indicate the isotopic creation of new materials. We should remind ourselves very briefly about the electron excitations in solids. The modern view of solid - state physics is based on the elementary excitations, having mass, quasi - impulse, electrical charge and soon on (see, e.g. [3] and references quoted therein). The model of electrons in solids arises from the consideration of the periodicity of the crystal structure. The electronic theory of solid provides us with a clear means of understanding how solid insulators, semiconductors, or metals may be. Below we very briefly consider the solution of the Schrödinger equation, which describes the electrons in solids. The total energy, Etot, of an electron in solid is the sum of its potential and kinetic energies. In classical terms one could express this relationship as
![]()
where U(r) describes the local potential energy of the particle at position r and the kinetic energy is given by the classical expression ![]() in which m is the particle mass and p is the momentum. This equation applies to any classical body. When the object in question is of a scale small enough that quantum mechanical behaviors become dominant, we need to rewrite Equation (1) in quantum mechanical terms. Under such conditions, the exact energy (E) at any specific time (t) cannot be described to within an accuracy better than
in which m is the particle mass and p is the momentum. This equation applies to any classical body. When the object in question is of a scale small enough that quantum mechanical behaviors become dominant, we need to rewrite Equation (1) in quantum mechanical terms. Under such conditions, the exact energy (E) at any specific time (t) cannot be described to within an accuracy better than![]() where
where ![]() is Plank’s constant divided by 2π. To account for this uncertainty the particle must be described by a probability distribution (its wave function) rather than by indicating a specific position. Its total energy is given by the change in the wave function,
is Plank’s constant divided by 2π. To account for this uncertainty the particle must be described by a probability distribution (its wave function) rather than by indicating a specific position. Its total energy is given by the change in the wave function,![]() per unit time multiplied by
per unit time multiplied by![]() , where i2 = -1. The momentum of a quantum article is, likewise, the spatial derivative of the wave function multiplied by
, where i2 = -1. The momentum of a quantum article is, likewise, the spatial derivative of the wave function multiplied by![]() . Based on the classical behavior and using the mathematics of operators, the kinetic energy, p2/2m becomes the second derivative of the wave function times -
. Based on the classical behavior and using the mathematics of operators, the kinetic energy, p2/2m becomes the second derivative of the wave function times - ![]() Similarly, the potential energy represents a weighted average potential using Ψ as the weighting function. Substituting these expressions in Equation (1) yields:
Similarly, the potential energy represents a weighted average potential using Ψ as the weighting function. Substituting these expressions in Equation (1) yields:
![]() (2)
(2)
where ![]() is referred to as the Laplacian and is the second spatial derivative of the function it operates on (in this case the wave function). Equation (2) is the full-time dependent Schrödinger equation and describes not only the steady - state behavior of an electron but also the way in which the electron changes energy as a function of time. Whenever the potential that the electron experiences does not change with time, the time variable can be separated from the space variable. In this case, the energy of the particle cannot change with time, and the spatial - portion of the Schrödinger equation becomes:
is referred to as the Laplacian and is the second spatial derivative of the function it operates on (in this case the wave function). Equation (2) is the full-time dependent Schrödinger equation and describes not only the steady - state behavior of an electron but also the way in which the electron changes energy as a function of time. Whenever the potential that the electron experiences does not change with time, the time variable can be separated from the space variable. In this case, the energy of the particle cannot change with time, and the spatial - portion of the Schrödinger equation becomes:
 (3)
(3)
where![]() is the time-independent wave function. The electronic structure of solids is derived by the solution of this equation under the boundary conditions appropriate to the solid being modeled (see, e.g. [4]). We will now consider the simplest form of Equation (3). The special case of
is the time-independent wave function. The electronic structure of solids is derived by the solution of this equation under the boundary conditions appropriate to the solid being modeled (see, e.g. [4]). We will now consider the simplest form of Equation (3). The special case of ![]() where there is no potential affecting the motion of electrons. For simplicity we will make the further restriction of considering only a one - dimensional problem. In this case,
where there is no potential affecting the motion of electrons. For simplicity we will make the further restriction of considering only a one - dimensional problem. In this case,
![]() (4)
(4)
The general solution to this equation, obtained by Fourier transform methods, is a linear combination of two waves moving in the positive and negative x directions:
![]() (5)
(5)
where A+ and A_ are the amplitudes of the two waves, and![]() is the wavenumber of the waves (electrons) with wavelength λ. The energies of these waves are determined by substituting equation (5) into (4). The second derivative of Ψ(x) from Equation (5) is d2Ψ(x)/dx2 = k2Ψ(x). Thus,
is the wavenumber of the waves (electrons) with wavelength λ. The energies of these waves are determined by substituting equation (5) into (4). The second derivative of Ψ(x) from Equation (5) is d2Ψ(x)/dx2 = k2Ψ(x). Thus,
![]() (6)
(6)
from which ![]() This holds for any A+ and A_ but requires
This holds for any A+ and A_ but requires ![]() for a wave with unit amplitude. The Ψ(x) are known as eigenvectors of equation (4) and the energies are the eigenvalues. The momentum of this wave is
for a wave with unit amplitude. The Ψ(x) are known as eigenvectors of equation (4) and the energies are the eigenvalues. The momentum of this wave is![]() thus k represents the electron momentum to within a factor of
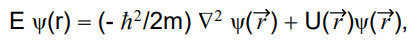
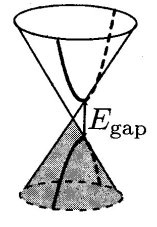
thus k represents the electron momentum to within a factor of![]() . The energy E as function k is illustrated in Fig. 1. We can characterize insulators by the energy gap Eg (Fig. 1) between the top of the highest filled band(s) and the bottom of the lowest empty band(s). A solid with an energy gap will be nonconducting at T = 0 K.
. The energy E as function k is illustrated in Fig. 1. We can characterize insulators by the energy gap Eg (Fig. 1) between the top of the highest filled band(s) and the bottom of the lowest empty band(s). A solid with an energy gap will be nonconducting at T = 0 K.
Figure 1: Various possibilities to present the band - structure of homogeneous undoped insulator (semiconductor). 1 - the dispersion relation, i.e., the energy E as a function of the wave vector k,2 - the energy regions of allowed and forbidden states as function of a space coordinate x and 3 -the density of states (all curves are schematic ones).
However, when the temperature is not zero there is a no vanishing probability that some electrons will be thermally excited across the energy gap into the lowest unoccupied bands, which we traditionally are called, the conduction bands, leaving behind unoccupied levels in the highest occupied bands, called valence band (Fig. 1).
Whether such thermal excitation lead to appreciable conductivity depends critically on the size of the energy gap, for the fraction of electrons excited across the gap at temperature T is, roughly of order![]() With an energy gap of 4 eV at room temperature
With an energy gap of 4 eV at room temperature![]() this factor is e-80 » 10-35, and essentially no electrons are excited across the gap. If, however, Eg = 0.25 eV, then the factor at room temperature is e-5 » 10-2, and observable conduction will occur. Solids that are insulators at T = 0 K, but whose energy gaps are of such that thermal excitations can lead to observable conductivity at temperatures below the melting point, are known as semiconductors. Evidently the distinction between a semiconductor and an insulator is not a sharp one, but roughly speaking the energy gap in the most important semiconductor is less than 2 eV [1] and frequently as low a few tenths of an electron volt. Typical room temperature resistivities of semiconductors are between 10-3 and 199 ohm-cm (in contrast to metals, where ρ » 10-6 ohm-cm, and a good insulator, where ρ can be as large as 1022 ohm-cm). The most striking feature of semiconductors is that, unlike metals, their electrical resistance declines with rising temperature, i.e., they have a negative coefficient of resistance. We should add that within the band theory photoconductivity find simple explanations. This energy gap defines the upper edge of the window of optical transmission allowed by perfect crystal. The large band gap automatically gives relatively large effective masses me and mh for free electrons and holes [3].
this factor is e-80 » 10-35, and essentially no electrons are excited across the gap. If, however, Eg = 0.25 eV, then the factor at room temperature is e-5 » 10-2, and observable conduction will occur. Solids that are insulators at T = 0 K, but whose energy gaps are of such that thermal excitations can lead to observable conductivity at temperatures below the melting point, are known as semiconductors. Evidently the distinction between a semiconductor and an insulator is not a sharp one, but roughly speaking the energy gap in the most important semiconductor is less than 2 eV [1] and frequently as low a few tenths of an electron volt. Typical room temperature resistivities of semiconductors are between 10-3 and 199 ohm-cm (in contrast to metals, where ρ » 10-6 ohm-cm, and a good insulator, where ρ can be as large as 1022 ohm-cm). The most striking feature of semiconductors is that, unlike metals, their electrical resistance declines with rising temperature, i.e., they have a negative coefficient of resistance. We should add that within the band theory photoconductivity find simple explanations. This energy gap defines the upper edge of the window of optical transmission allowed by perfect crystal. The large band gap automatically gives relatively large effective masses me and mh for free electrons and holes [3].
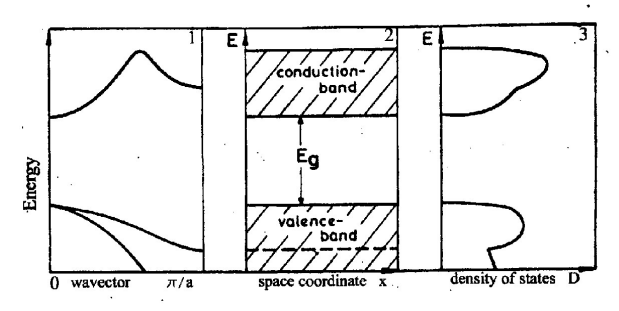
An elementary inter band excitation process in Fig. 1 automatically creates a positive hole in the vicinity of the excited electron at the bottom of the conduction band. The attractive Coulomb potential between the missing electron in the valence band, which can be regarded as a positively charged hole, and the electron in the conduction band gives a hydrogen - like spectrum with an infinitive number of bound state and ionization continuum Fig. 2 This is the free exciton [5].
Figure 2: Discrete and continuous (hatched area) Wannier - Mott exciton energy spectrum taking into account its kinetic energy ![]() The broken line connects to the dispersion of light in the medium. R - is the exciton binding energy, n = 1, 2, 3.
The broken line connects to the dispersion of light in the medium. R - is the exciton binding energy, n = 1, 2, 3.
The centre of mass![]() of the exciton can move through the crystal by diffusional or drift process, just like the individual electronic particles. However, this exciton migration does not of itself produce electrical conductivity. As was said above, isotopically pure materials represent a separate class of modern materials science, which is an accelerator of the development of the latest fine technology. First of all, it is necessary to remember due to this explosive leap in the development of electronic and optical technologies. It is thanks to isotopically pure silicon used in personal computer processors that it has been possible to step beyond the 3GHz threshold. Moreover, isotopically pure germanium is the weakest signal detector. Low dimensional structures of quantum wires (QW), quantum dots (QD) received a new impetus for development when using isotopically pure materials, as well as artificially regulating the isotopic composition of a material. We emphasize that due to the wide class of allotropic carbon compounds, the physical properties of which vary from transparent in the ultraviolet (UV) range (diamond) to opaque (graphite, graphene), from dielectric (diamond) to a compound with metallic conductivity (graphene) and also which have extremely different elastic and thermal properties - all of the above-mentioned characteristics exhibit isotopic dependence. We must 12C for a heavy isotope 13C. Semiconductor graphene could replace all silicon electronics. Of course, the new technology for the development of quantum computer (QC) processors is based on the use of materials with different spin values. Great demand for isotopically pure materials from control agencies. for example, a special requirement for isotopically pure silicon, from which it is planned to make a control sample of 1 kg. We will not at all touch upon the very wide applications of pure isotopes in biophysics and medicine. As an example, let us point out that only one country (USA) uses tens of thousands of tons of different isotopes per year. This short list of applications for isotopic materials stimulates the detailed study of the physical characteristics of isotopic materials.
of the exciton can move through the crystal by diffusional or drift process, just like the individual electronic particles. However, this exciton migration does not of itself produce electrical conductivity. As was said above, isotopically pure materials represent a separate class of modern materials science, which is an accelerator of the development of the latest fine technology. First of all, it is necessary to remember due to this explosive leap in the development of electronic and optical technologies. It is thanks to isotopically pure silicon used in personal computer processors that it has been possible to step beyond the 3GHz threshold. Moreover, isotopically pure germanium is the weakest signal detector. Low dimensional structures of quantum wires (QW), quantum dots (QD) received a new impetus for development when using isotopically pure materials, as well as artificially regulating the isotopic composition of a material. We emphasize that due to the wide class of allotropic carbon compounds, the physical properties of which vary from transparent in the ultraviolet (UV) range (diamond) to opaque (graphite, graphene), from dielectric (diamond) to a compound with metallic conductivity (graphene) and also which have extremely different elastic and thermal properties - all of the above-mentioned characteristics exhibit isotopic dependence. We must 12C for a heavy isotope 13C. Semiconductor graphene could replace all silicon electronics. Of course, the new technology for the development of quantum computer (QC) processors is based on the use of materials with different spin values. Great demand for isotopically pure materials from control agencies. for example, a special requirement for isotopically pure silicon, from which it is planned to make a control sample of 1 kg. We will not at all touch upon the very wide applications of pure isotopes in biophysics and medicine. As an example, let us point out that only one country (USA) uses tens of thousands of tons of different isotopes per year. This short list of applications for isotopic materials stimulates the detailed study of the physical characteristics of isotopic materials.
Results and Discussions
The equipment used in experiments has been described many times earlier [1, 2]. Note that low - temperature optical spectra (reflection, luminescence, light scattering) were measured using laser (lamp) excitation, standard monochromators and photon counting with storage in the memory of a personal computer (see, also [3]).
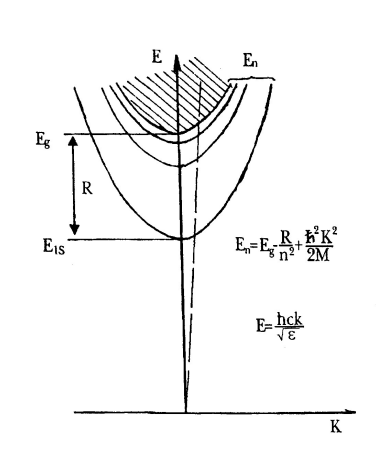
The usual way to determine the optical properties of a solid is to shine monochromatic light onto an appropriate sample and then to measure the reflectance or transmittance of the sample as a function of photon energy. In the spectral region of greatest interest is generally quite high, so that often a negligible small fraction of the incident light is transmitted. It is the main reason that the most experiments are measurements of reflectivity. The mirror reflection spectra of mixed and pure LiH and LiD crystals, cleaved in superfluid helium, are presented on Fig. 3. All spectra have been measured with the same apparatus under the same conditions. As can clearly seen in Fig. 3, all spectra exhibit a similar long – wave structure. As the deuterium concentration increases, the long – wave maximum (n = 1S excitons [2]) broadens and shifts towards the shorter wavelengths. The energy values of exciton maxima for pure and mixed crystals at 2 K are presented in Table 2 of reference [2]. As demonstrated early most low - energy electron excitation in LiH crystals is the large - radius excitons [2, 5].
Figure 3: Mirror reflection spectra of indicated crystals at 2 K. Light sources without crystals indicates by lamp.
Photoluminescence is the optical radiation emitted by a physical system (in excess of the thermal equilibrium blackbody radiation) resulting from excitation to a nonequilibrium state by irradiation with light. Photoluminescence is also rapidly evolving into a major basic research tool comparable to absorption (reflection) measurements in importance. Two reasons for this stand out as significant. First is the sensitivity of the luminescence technique. It often happens that features which are just discernible in absorption will completely dominate the luminescence spectra. The converse is also sometimes true, making luminescence and absorption (reflection) complementary techniques. Second is the simplicity of data collection. In the last half- century, the luminescence method has become one of the most common techniques for studying excitons in dielectrics and semiconductors. While the structure of spectra of fundamental reflection (absorption) depends on the internal degrees of freedom of Wannier – Mott exciton, the structure and shape of the luminescence spectrum are determined primarily by its external degrees of freedom. The latter are associated with the translation motion of large – radius exciton as a whole, with the translation mass![]() , where me and mh – effective masses of electron and hole, respectively.
, where me and mh – effective masses of electron and hole, respectively.
Free exciton luminescence is observed when LiH (LiD) crystals are excited in the midst of the fundamental absorption. The spectrum of free exciton photoluminescence of LiH crystals cleaved in superfluid helium consists of a narrow (in the best crystals, its half - width is ΔE £ 10 meV) phononless emission line and its broader phonon repetitions, which arise due to radiated annihilation of excitons with the production of one to five longitudinal optical (LO) phonons (see Fig. 4).
Figure 4: Photoluminescence spectra of free excitons at 2 K in LiH and LiD crystals cleaved in superfluid helium.
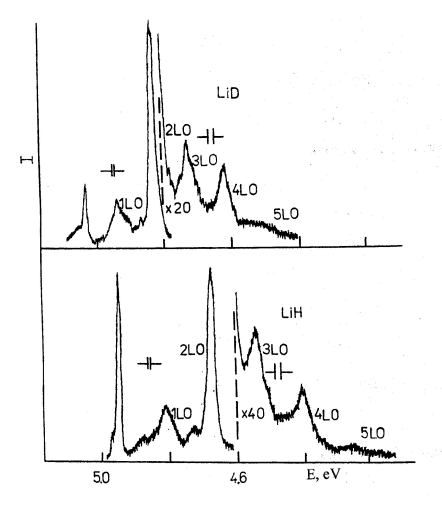
The phonon less emission line coincides in an almost resonant way with the reflection line of the exciton ground state which is indication of the direct electron transition X? - X? of the first Brillouin zone [6]. The lines of phonon replicas form an equidistant series biased toward lower energies from the resonance emission line of excitons. The energy difference between these lines in LiH crystals is about 140 meV, which is very close to the calculated energy of the LO phonon in the middle of the Brillouin zone [2]. The isotopic shift of the zero - phonon emission line of LiH crystals equals 103 meV. As we can see from Fig. 4 the photoluminescence spectrum of LiD crystals is largely similar to the spectrum of intrinsic luminescence of LiH crystals. There are, however, some distinctions one is related to. Firstly, the zero - phonon emission line of free excitons in LiD crystals shifts to the short - wavelength side on 103 meV. These results directly show the violation of the strong conclusion (see, e.g. [3, 7] and references quoted therein) that the strong force does not act on leptons. The second difference concludes in less value of the LO phonon energy, which is equal to 104 meV. The simplest approximation, in which crystals of mixed isotopic composition are treated as crystals of identical atoms having the average isotopic mass, is referred to as virtual crystal approximation (VCA) [2]. Direct experimental observation of the luminescence spectra of free excitons in an isotopically created new substance (LiD crystals) is shown in Fig. 4.
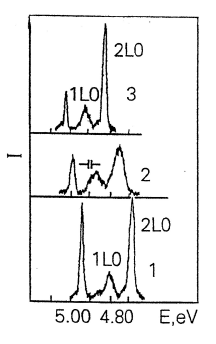
When light is excited by photons in a region of fundamental absorption in mixed![]() crystals at low temperature, line luminescence is observed (Fig. 4), like in the pure LiH and LiD crystals [2]. As before [8], the luminescence spectrum of crystals cleaved in superfluid liquid helium consists of the relatively zero - phonon line and its wide LO replicas. For the sake of convenience, and without scarfing generality, Fig. 5 shows the lines of two replicas. Usually up to five LO repetitions are observed in the luminescence spectrum as described in detail in [2]. In Fig. 5 we see immediately that the structure of all three spectra is the same. The difference is in the distance between the observed lines, as well as in the energy at which the luminescence spectrum begins, and in the half - width of the lines.
crystals at low temperature, line luminescence is observed (Fig. 4), like in the pure LiH and LiD crystals [2]. As before [8], the luminescence spectrum of crystals cleaved in superfluid liquid helium consists of the relatively zero - phonon line and its wide LO replicas. For the sake of convenience, and without scarfing generality, Fig. 5 shows the lines of two replicas. Usually up to five LO repetitions are observed in the luminescence spectrum as described in detail in [2]. In Fig. 5 we see immediately that the structure of all three spectra is the same. The difference is in the distance between the observed lines, as well as in the energy at which the luminescence spectrum begins, and in the half - width of the lines.
Figure 5: Photoluminescence spectra of free excitons in LiH (1),![]() (2) and LiD (3) crystals cleaved in superfluid helium at 2 K. Spectrometer resolution is shown.
(2) and LiD (3) crystals cleaved in superfluid helium at 2 K. Spectrometer resolution is shown.
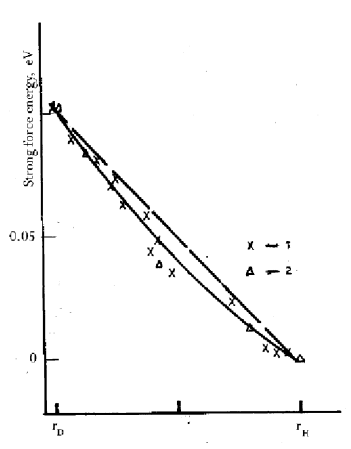
The measurements of the low temperature of reflection [9] and luminescence spectra of the whole series of mixed crystals is permitted to obtain the dependence of the interband transition energy on the isotope’s concentration. Taking into account that the concentration is to vary directly the lattice constant [7] we are plotting the dependence of the band - gap energy (the power of the force strong interaction) on the distance between nucleons depicted on Fig. 6. This dependence has a nonlinear character. As can be seen from Fig. 6, VCA method (the straight dashed line) cannot describe observed experimental results.
Comparing the experimental results on the luminescence (reflection) and light scattering [2] in the crystals which differ by a term of one neutron only is allowed to the next conclusions.
Figure 6: The force dependence of strong nuclear interaction on the distance between nucleons in deuterium nucleus. The straight dashed line is the linear dependence of the force dependence in the virtual model.
Traditionally nuclear - electron interaction (in our case neutron - electron interaction) taking into account the solving of Schrodinger equation using a model of Born - Oppenheimer (adiabatic) approximation [10]. Since electrons are much faster and lighter than the nuclei by a factor nearly 2000 the electron charge can quickly rearrange itself in response to the slower motion of the nuclei, and this is the essence of the Born - Oppenheimer approximation.
This approximation results in the omission of certain small terms which result from the transformation. As was shown in [24] the eigenvalue (energy) of the electronic Schrödinger equation (equation 6 in [11]) depends on the nuclear charges through the Coulomb potential, but it doesn’t include any references to nuclear mass, and it is the same for the different isotopes. The independence of the potential energy (the eigenvalue of the Schrödinger equation) is the essence of adiabatic approximation. However, we must repeat, that the Born - Oppenheimer approximation is the standard anzatz to the description of the interaction between electrons and nuclei in solids (see, however below). Now we should take into account a small contribution to isotopic shift through reduced electron mass![]() so far as MNucl is different for the hydrogen and deuterium nucleus. In this case the contribution equals
so far as MNucl is different for the hydrogen and deuterium nucleus. In this case the contribution equals ![]() Contribution to isotope shift of the zero - phonon line in luminescence spectra of LiD crystals as well as Lamb shift and specific Coulomb potential approximately equal 1, and 1 meV, respectively. This value is less than isotope shift in our experiments on the two order and more. The last result is forcing us to search for new models and mechanisms of nuclear - electron interaction including results of subatomic physics, e.g., hadron - lepton interaction [12]. ‘
Contribution to isotope shift of the zero - phonon line in luminescence spectra of LiD crystals as well as Lamb shift and specific Coulomb potential approximately equal 1, and 1 meV, respectively. This value is less than isotope shift in our experiments on the two order and more. The last result is forcing us to search for new models and mechanisms of nuclear - electron interaction including results of subatomic physics, e.g., hadron - lepton interaction [12]. ‘
The formulation of the model explaining the non - accelerator experimental results on the mass isotope effect requires a more careful analysis of the origin of the four fundamental forces. It is reasonable to recall that more than three decades ago, Barut [13] hypothesized that all fundamental forces have an electromagnetic nature (see, also [14]).
Theory strong nuclear interaction is the heart of quantum chromodynamics (QCD) which is part of the standard model (SM) [15, 16], therefore the base exchange is the gluon which mediates the forces between quarks. The effective coupling constant of this theory grows when the energy decreases.
As a result, particles which feel this interaction cannot exist as free states and appear only in the form of bound states called hadrons (see, also [12]). Most of modern methods of quantum field theory work at small values of coupling constant, as, [17], that is, for QCD, at high energies (or short distances). Taking into account that in our experiments we study strong force on very large distance (»104 more than in nuclear physics) we may expect the very large value of as. Using the magnitude of the anomalous value of the magnetic moment of the neutron and the experimentally observed value of the isotopic shift energy at 0.103 eV the value of the strong interaction constant was found in the paper [22] equal to 2.4680 which is very different from the results found from the data of accelerator technology ![]() .From this it can be seen that the isotopic created new material lithium deuteride for the first time makes it possible to study quantitatively not only nuclear but also high energy physics.
.From this it can be seen that the isotopic created new material lithium deuteride for the first time makes it possible to study quantitatively not only nuclear but also high energy physics.
Another very interesting example is carbon. Carbon atom is built from 6 protons, A neutrons and 6 electrons, where A = 6 or 7, yield the stable isotopes 12C and 13C, respectively, and A = 8 characterizes the radioactive isotope 14C [18]. The isotope 12C, with nuclear spin I= 0, is the most common one in nature with 99% of all carbon atoms, whereas only are 13C with nuclear spin I =1/2. There are only traces of 14C (10-12 of all carbon atoms) which transforms into nitrogen 14N by β - decays. Although 14C only occurs rarely, it is an important isotope used for historical dating. Carbon, one of the most elements in nature, still gives a lot surprises. It is found in many different forms - allotropes - from zero-dimensional fullerene, one dimensional carbon nanotubes, two-dimensional graphene and graphite, to three-dimensional diamond - and the properties of the various carbon allotropes can vary widely [19]. For instance, diamond is the hardest material, while graphite is one of the softest; diamond is transparent to the visible part of spectrum, while graphite is opaque; diamond is an electrical insulator, while graphite and graphene are conductors.
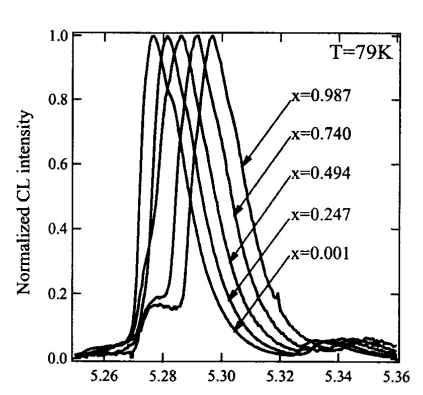
Very important is that all these different properties originate from the same carbon atoms, simply with different arrangements of the atomic structure. Below we describe the new phenomena of the carbon - isotope effect in diamond. Crystals 12C and 13C diamond differ by only one neutron. Due to the indirect gap of Eg =5.47 ± 0.005 eV (295 K), at K = 0.76 X, diamond has intrinsic phonon - assisted free exciton luminescence lines (see, e.g. [1, 2]). The change of the indirect gap of diamond between pure 12C and 13C crystals has been numerous determined (see, e.g. [1] and reference quoted therein). Fig. 7 presented the results of paper [20]. We can see the continuous increase in the band - gap with growth of the 13C concentration. This is a direct show of the act of the strong interaction on the leptons [12]. Watanabe et al. have concluded that the maximum change of the band gap due to substitution of 12C by 13C is This value per one neutron and on seven neutrons we get 15.4 x 7 108 meV. This value is very close to the observed one (103 meV) in LiD crystals.
Figure 7: Luminescence spectra of free excitons in homoepitaxial diamond films grown from mixture of methane in hydrogen by means of a microwave plasma - assisted CVD. The spectra illustrate the effects of isotope composition mixed in the CVD gas phase. All spectra are normalized to the same height (after [20]).
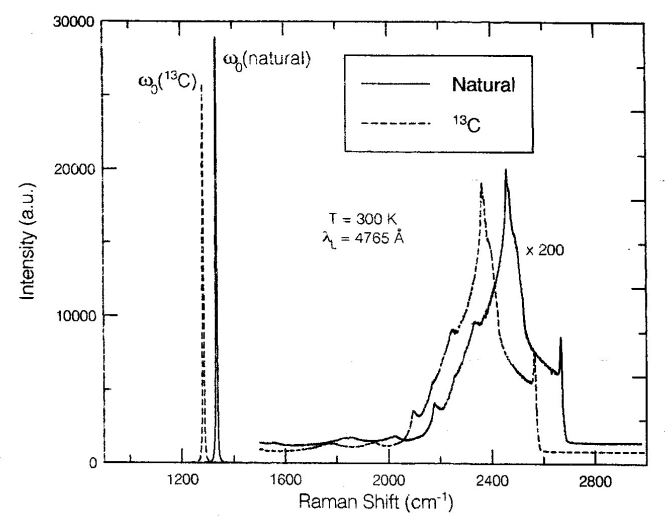
Raman spectroscopy is a powerful means to gain experimental access to phonons and their interaction and scattering mechanisms [1, 2]. First - order Raman light scattering spectrum in diamond crystals also includes one line with maximum![]() 1332.5 cm-1 [21]. In Fig. 8 the first - order scattering spectrum in diamond crystals with different isotope concentrations is shown. As was shown in [1], the maximum and width of the first - order scattering line in isotopically - mixed diamond crystals are nonlinearly dependent on the concentration of isotopes x. The maximum shift of this line is 52.3 cm-1 corresponding to the two limiting values of x = 0 and x = 1. The effect of the isotopic 12C to 13C ratio on the first - and second - order Raman scattering of light in the diamond has been numerous investigated. As 13C content is increased from the natural ratio the whole spectrum has shifted towards longer wavelength (Fig. 8) in good agreement with the expected M-0.5 frequency dependence on the reduced mass M. For an approximately equal mix of the two isotopes, the authors reported that the features seen in the above two - phonon spectra were either broadened or unresolved.
1332.5 cm-1 [21]. In Fig. 8 the first - order scattering spectrum in diamond crystals with different isotope concentrations is shown. As was shown in [1], the maximum and width of the first - order scattering line in isotopically - mixed diamond crystals are nonlinearly dependent on the concentration of isotopes x. The maximum shift of this line is 52.3 cm-1 corresponding to the two limiting values of x = 0 and x = 1. The effect of the isotopic 12C to 13C ratio on the first - and second - order Raman scattering of light in the diamond has been numerous investigated. As 13C content is increased from the natural ratio the whole spectrum has shifted towards longer wavelength (Fig. 8) in good agreement with the expected M-0.5 frequency dependence on the reduced mass M. For an approximately equal mix of the two isotopes, the authors reported that the features seen in the above two - phonon spectra were either broadened or unresolved.
The measured dependence on average mass mainly reflects the isotope effect on the harmonic frequency which is, however, modified by anharmonic and disorder -induced contributions [9]. Isotope renormalization frequencies of phonons of other semiconducting crystals (GaP, GaAs, a - Sn, ZnS, ZnO, CuCl, CuBr) was published in the next reviews [1, 2]. We should highlight that the addition of one next neutron in nuclei is called the change in more or less of energy of elementary excitations in solids.
All sp2 - bonded carbons show common features in their Raman spectra, the so - called G and D peaks (see, e.g., Fig. 6 in [19]), around 1580 and 1360 cm-1). The G peak corresponds to the E2g phonon at the Brillouin zone center (Γ - point). The D peak is due to the breathing modes of six - atom rings and requires a defect for its activation.
Figure 8: The Raman spectra of natural and a 13C diamond. The spectra show the dominant first - order Raman - active F2g line and the significantly weaker quasi - continuous multiphonon features (after [21]).
It comes from TO phonons around the Brillouin zone K point and it is activated by an intravalley scattering process [19]. The 2D peak is the second order of the D peak. This is a single peak in monolayer graphene, whereas it splits into four bands in bilayer graphene, reflecting the evolution of the band structure (see, e.g., reference [12]). The Raman spectrum of graphene also shows significantly less intensive defect - activated peaks such as the D’ peak, which lies at ~ 1620 cm-1. This is activated by an intravalley process i.e., connecting two points belonging to the same cone around K. The second order of the D’ peak is called 2D’ peak. Since 2D and 2D’ peaks originate from a Raman scattering process where momentum conservation is obtained by the participation of two phonons with opposite wave vectors ![]() they do not require the presence of defects. Thus, they are always visible in the Raman spectrum (see cited papers in [19]).
they do not require the presence of defects. Thus, they are always visible in the Raman spectrum (see cited papers in [19]).
As in the case of isotope - mixed diamond [21] the Brillouin - zone - center optical - phonon frequency ω varies with the atomic mass M as ![]() making the Raman shift for 13C approximately (12/13)-1/2 times smaller than that for 12C (see, also [1, 2]). The experimental difference between the lowest 99.2% 13C and the highest 0.01% 13C peak is ~ 64 cm-1which is according [19] in agreement with the theory, and attests for the high quality of isotopically modified graphene. By the way we should repeat that in the Raman spectra in diamond (with sp3 - bond) analogous shift of first - order line in Raman spectrum is equal 52.3 cm-1 [1, 2], which is consistent with the isotope mass ratio. Substituting a light isotope (12C, H) with a heavy one increases the interband transition energy in the case
making the Raman shift for 13C approximately (12/13)-1/2 times smaller than that for 12C (see, also [1, 2]). The experimental difference between the lowest 99.2% 13C and the highest 0.01% 13C peak is ~ 64 cm-1which is according [19] in agreement with the theory, and attests for the high quality of isotopically modified graphene. By the way we should repeat that in the Raman spectra in diamond (with sp3 - bond) analogous shift of first - order line in Raman spectrum is equal 52.3 cm-1 [1, 2], which is consistent with the isotope mass ratio. Substituting a light isotope (12C, H) with a heavy one increases the interband transition energy in the case![]() on 14.7 meV and
on 14.7 meV and![]() on 103 meV [1]. Taking into account a softer bond (sp2 - bond instead sp3 - bond in diamond) isotope - induced band - gap opening in graphene of some hundreds meV (up to Eg of Si) was predicted earlier (see [19] and reference therein). Such estimation of the value of isotopical band - gap opening in graphene agrees with not only the results of paper [19] but with very small value C44 = 0.5.1010 dyn/cm2. Such small value indicates on the strong electron - photon interaction - main reason renormalization of electron excitation energy (for the details, see, e.g. [1, 2]). The isotopic creation of a new material based on graphene with metallic conductivity is of extreme interest, since in this case a new semiconductor material is obtained (Fig. 9). Especially graphene nanostructures are promising candidates for future nanoelectronics and solid - state quantum information technology. As was shown numerously (see, e.g. [23]), in the vicinity of K - points of the Brillouin zone, the low - energy electron/hole dispersion relation is proportional to momentum, rather than its square (see Fig. 9). This is analogous to the energy dispersion relation of massless relativistic electrons, so the electrons/holes of graphene are described as Dirac fermions having no mass.
on 103 meV [1]. Taking into account a softer bond (sp2 - bond instead sp3 - bond in diamond) isotope - induced band - gap opening in graphene of some hundreds meV (up to Eg of Si) was predicted earlier (see [19] and reference therein). Such estimation of the value of isotopical band - gap opening in graphene agrees with not only the results of paper [19] but with very small value C44 = 0.5.1010 dyn/cm2. Such small value indicates on the strong electron - photon interaction - main reason renormalization of electron excitation energy (for the details, see, e.g. [1, 2]). The isotopic creation of a new material based on graphene with metallic conductivity is of extreme interest, since in this case a new semiconductor material is obtained (Fig. 9). Especially graphene nanostructures are promising candidates for future nanoelectronics and solid - state quantum information technology. As was shown numerously (see, e.g. [23]), in the vicinity of K - points of the Brillouin zone, the low - energy electron/hole dispersion relation is proportional to momentum, rather than its square (see Fig. 9). This is analogous to the energy dispersion relation of massless relativistic electrons, so the electrons/holes of graphene are described as Dirac fermions having no mass.
Figure 9: The energy dispersion of semimetal (solid line) and semiconductor (dashed line).
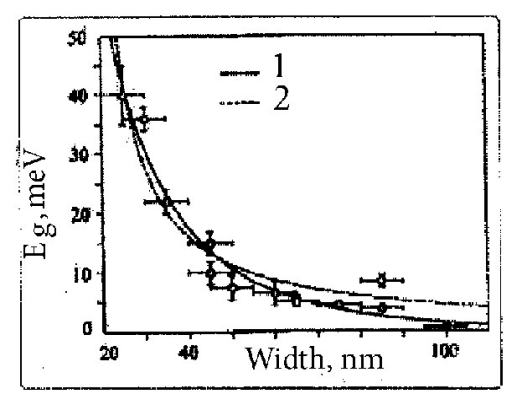
In order to make graphene a real technology, a special issue must be solved: creating an energy gap at K - points in the Brillouin zone (see, Fig.9). Different attempts have been made by researchers, such as patterning graphene into nanoribbon, forming graphene quantum dots, making use of multilayer graphene sheet and applying an external electric field [19]. It was shown that the uniaxial strain can open a band - gap in a metallic carbon nanotube as well as carbon nanoribbon. As an example, Fig. 10 shows the dependence of the energy of interband transition on the width of the graphene nanoribbons. The observed dependence is well described by the following expression![]() where a* = 0.38 eV/nm, and W* = 16 nm accounts for inactive edges [24]. This formula gives Eg equal to several eV, if W is reduced to a size, for example 13C, but it is impossible. The isotopic transformation of graphene, a semimetal into semiconductor deserves special attention [19, 25] This means of the cone’s dispersion pattern
where a* = 0.38 eV/nm, and W* = 16 nm accounts for inactive edges [24]. This formula gives Eg equal to several eV, if W is reduced to a size, for example 13C, but it is impossible. The isotopic transformation of graphene, a semimetal into semiconductor deserves special attention [19, 25] This means of the cone’s dispersion pattern![]() at the K point of the Brillouin zone of graphene reformes into the usual parabolic dispersion of band structure pattern (see Fig. 9).
at the K point of the Brillouin zone of graphene reformes into the usual parabolic dispersion of band structure pattern (see Fig. 9).
Figure 10: The dependence of Eg as a function of width of the graphene nanoribbons (after [24]).
According to the results of Ref. 12 the isotopic method can be used to obtain Eg of several hundred meV. The value of Eg depends on the concentration of 13C in graphene, this mechanism is easily realized either chemically or technologically. With the opening Eg of massless fermions (leptons = electrons) acquire mass. Estimates of different ways of opening Eg in graphene give the following equality: Eg = 2m [25]. When Eg = 1 eV [19] leptons acquire a mass equal 0.5 eV - the value is not large, but finite. One of the mechanisms of acquiring mass in elementary particle physics is considered in the paper [26]. This paper predicts that both quarks and gluons acquire running mass distribution in QCD, which are large at infrared momenta. The current quark of perturbative QCD evolves into a constituent quark as its momentum becomes smaller. The constituent quark mass arises from a cloud of low - momentum gluons attaching themselves to the current quark. This is DCSB: an essentially nonperturbative effect that generates a quark mass from nothing; namely it occurs even in the chiral limit. DCSB namely the generation of mass from nothing is a theoretically established nonperturbative feature of QCD. The solution of a gap equation shows that gluons are cannibals: they are particle species whose members become massive by eating each other (the details see [19, 26]).
Conclusion
Neutron(s) activation of substances with a small atomic number leads to very large changes in the characteristics of elementary excitations. These changes are so great that they make it possible to speak of the isotope substitution method as the creation of new materials,
- These are well - known isotopes of hydrogen - deuterium and tritium which find an unusually wide demand in human activities and science.
- Obtaining super hard material - diamond from 13C.
- Obtaining semiconductor material from metal graphene from 13C.
- Fullerene from 13C is a new material with unusual characteristics.
References
- M Cardona, MLW Thewalt (2005) Isotope effect on the optical spectra of semiconductors. Rev Mod Phys 77: 1173 – 1224.
- V G Plekhanov (2005) Elementary excitation in isotope - mixed crystals, Phys. Reports 410: 1 – 235.
- V G Plekhanov (Springer, Heidelberg, 2018). Introduction to Isotopic Materials Science.
- D Pines (W.A. Benjamin Inc., New York, 1963) Elementary Excitarions in Solids.
- R.S. Knox (Academic Press, New York - London, 1963) Theory of Excitons.
- S Baroni, G Pastori Parravicini, G Pezzica (1985) Quasiparticle band structure of lithium hydride, Phys. Rev. B 32: 4077 – 4083.
- V G Plekhanov, Isotope effect is the paradigm of a non - accelerator study of the residual nuclear strong interaction, Edelweiss Chemical Science Journal 3, 8 - 14 (2020); (1985) Dependence of the Yukawa potential on the distance between nucleons, in, Progress in Chemical Science Research 7: 51 – 61.
- V G Plekhanov (1997) Isotopic and disorder effects in large exciton spectroscopy, Uspekhi - Phys (Moscow) 46: 553 – 579.
- V G Plekhanov (Stefan University, La Jola, CA, 2004) Giant Isotope Effects in Solids.
- M Born, H Run, (Clarendon Press, Oxford,1954) Dynamical Theory of Crystal Lattices.
- V G Plekhanov (2019) Measurements of the wide value range of strong interaction coupling constant, SSRG - IJAP 6: 32 - 37; in Understanding Quarks, chapter 1, (Nova Science Publishers, Inc., New York, 2021).
- V G Plekhanov (Services for Science and Education, United Kingdom, 2021) (e - print) Hadron - Lepton Strong Interaction.
- FO Barut (1986) Unification based on electromagnetism, Annalen Phys. (Leipzig) 498: 83 – 92.
- V G Plekhanov (2022) Isotopic effect - macroscopic manifestation of the strong nuclear long - range interaction. Atomic Energy 131: 121 – 126.
- WN Cottingham, DA Greenwood, (Cambridge University Press, Cambridge, 2007) Introduction to Standard Model of Particles Physics.
- D.H. Perkins, (Cambridge University Press, Cambridge, 2000) Introduction to High Energy Physics.
- A Deur, SJ Brodsky, GF Teramond (2016) The QCD running coupling constant, Prog. Part. Nucl. Phys 90: 1 – 74.
- JE Field (Acaemic Press, New York, 1992) The Properties of Natural and Synthetic Diamond.
- V G Plekhanov (2020) Renormalization of the band - gap by isotope in graphene, Nano Techn and Nano Science J 3: 121 – 130.
- H Watanabe, T Koretsune, S Nakashina et al. (2013) Isotope composition dependence of the band - gap energy in diamond, Phys. Rev. B 88: 205420 –205425.
- A.K. Ramdas, S. Rodriguez, (1999) Lattice vibrations and electronic excitations in isotopically controlled diamond, phys. stat. sol 215: 71 – 80.
- V G Plekhanov, J Buitrago (2019) Evidence of residual strong interaction at nuclear - atomic level via isotope shift in LiH - LiD crystals. Prog. Phys 15: 68 -71.
- A Castro Net, F Guinea, NMR Peres et al. (2009) The electronic properties of graphene, Rev. Mod. Phys 81: 109 – 162.
- Ch Stampfer, S Fringe, J Gütinger et al. (2011) Transport in Grphene nanostructures, Front Phys 6: 271 – 293.
- Ken-ichi Sasaki (2018) Massive Dirac fermions signal in Raman spectrum of graphene, Phys. Rev. B 97: 115413 -115416.
- CD Roberts, Hadeon physics and QCD: Just the basic facts.