Comparative Studies of The Proximate, Microscopic and Thermal Properties of Processed Maize, Wheat, Millet, Cassava and Bambara nut Flours
Theophilus Maduabuchukwu Ikegwu1*, Iro Nkama2, Ifeanyi Gabriel Okafor2
1 Department of Food Science and Technology, Faculty of Agriculture, Nnamdi Azikiwe University, Awka, Anambra State, Nigeria.
2 Department of Food Science and Technology, Faculty of Agriculture, University of Nigeria, Nsukka, Enugu State, Nigeria.
*Corresponding Author:Theophilus M. Ikegwu, Department of Food Science and Technology, Faculty of Agriculture, Nnamdi Azikiwe University, Awka, Anambra State, Nigeria, Tel: +234-8066229783; Fax: +234-8066229783; E-mail: maduson2003@yahoo.com
Citation: Theophilus M. Ikegwu, Iro Nkama, Ifeanyi Gabriel Okafor (2021) Comparative Studies of The Proximate, Microscopicand Thermal Properties Ofprocessed Maize, Wheat, Millet, Cassava and Bambaranut Flours. Diabetes Cholest metabol 6: 140.
Received: October 19, 2022; Accepted: November 01, 2022; Published: November 11, 2022.
Copyright: © 2022 Theophilus M. Ikegwu, et al. This is an open-access article distributed under the terms of the Creative Commons Attribution License, which permits unrestricted use, distribution, and reproduction in any medium, provided the original author and source are credited.
Abstract
This research investigated and compared the proximate composition, microscopic and thermal properties of some grains (maize, wheat, and millet), a root crop (cassava) and a leguminous crop (bambara nut) with the intent to formulate novel food product with the desired characteristics for industrial processing. Native cassava flour is known to exhibit physicochemical characteristics that discourages its applications in food systems. However, composite flour formulation and the use of additives have the capacity to encourage the use of unmodified cassava flour to process food of an acceptable standard. Bambara nut is however, a leguminous crop but very high in ash and mineral contents which affects the taste and flavour of products produced from it. Furthermore, the high mineral composition of bambara nut contributes to increased anti-nutrients that contribute to high energy requirement during processing. Thus, these studies were carried out in response to processing needs. The results obtained showed increased starchy materials of the maize grain compared to the other grains while the bambara nut, been a legume, has the least carbohydrate content. Microscopically, the millet flour showed silvered-white indentations that evidenced presence of protein in the intact structure, unlike the other grains. The increased content of protein in the maize could be attributed to increased activity of α-amylase in the maize grain soaked for 48 hrs. The DSC of the flours indicates the A+V-type polymorphs were present in the flours. Wheat and maize flours contained high values of the amylose that could have contributed to the increased values of the enthalpy in their flours, although maturity of the grain during harvest could influence the amylose content and consequently, the enthalpy of foods. The FTIR-Spectroscopic studies showed that the millet flour possessed more ordered structure compared to the other grains. However, the Bambara nut flour has the highest ordered structure. Furthermore, cassava with more peaks contained more polymorphs and is expected to possess more complex structure.
Keywords
Keywords: Thermal Properties; Scanning Electron Microscopy; Proximate Composition; Flour; Ordered Structure
Introduction
Cassava (ManihotesculentaCrantz) is the main source of dietary food for energy in most of the developing worlds. It is largely cultivated in most of the tropical countries. It has been postulated that most people living in the lowland tropics as well as in sub-humid tropics of the west and central Africa obtain most of their dietary energy requirements from cassava. The relevance and predominance in the region stems from their ability to survive in poor soils, in addition to the viability of its cuttings. The attainment of food security is predicated on how cassava flours could be used in composite flour formulation. This has necessitated its recommendation for inclusion in composite flour formulation for the production of various bakery and confection products as well as in noodle production. This study evaluated the compositional properties of cassava, millet, bambara nut, maize and wheat flours.The physical treatment of starch granule may affect the natural molecular and structural arrangement as observed during annealing and various heat-moisture treatments (HTM). It has been observed that origin of starch as well as the conditions of treatment employed had effect on the physical properties of heat-moisture treatment (HTM) such that it increases in paste. Stability and gelatinization temperature are common, without recourse to the origin. DSC provides a semi-micron method for the observation of the behaviours of starch from small samples, or even from single grains or seeds. Microscopic examination of the thermal properties is obtained when samples are heated at a controlled rate (10oC/min) in the presence or absence of an excess (1:3, Starch/water ratio) or limited quantities of water.Differential thermal analysis techniques provide quantitative measures of heat flow associated with gelatinization; endothermic peaks are indicative of melting. This is a surface analytical method employed to study information on the outer surface/region of a sample. It is believed that the structural properties of surface of starch granules such as porosity, crystallinity, etc. are suggestive of the variations in starch granules as a result of amylose hydrolysis. Infra-red beam can penetrate into the first few micrometers (?2µm) of starch granules. The 2 µm penetration depth is normally smaller than the average size of starch granules. This implies that the IR spectra acquired are representative of the external part of the starch granules. The alternating growth rings of semi-crystalline and amorphous material are generally around 0.1 mm thick. This means that Attenuated Total Reflectance-Fourier Transform Infrared (ATR-FTIR), acquiring on a micron scale, measures the overall information from several growth rings.
Materials and Methods
Proximate Determinations
The contents of the carbohydrate, crude fiber, fat, crude protein, ash and moisture were determined using the AOAC [1] method.
Thermal Properties
Differential scanning calorimetry (DSC)
A DSC test was conducted in a differential scanning calorimeter after heating the sample from room temperature to 280°C at 10°C/min. About 10mm2 of film was conditioned at 25°C and 60% RH. The following factors were obtained through these thermo-grams: the onset temperature (To) and the peak temperature (Tp).
Structural Properties
Scanning electron microscopy (SEM)
A SEM S-3400N (Hitachi, Japan), operating at an acceleration voltage of 20 kv was used to study the fracture surface morphology of the samples. The film samples were mounted on bronze stubs using a double-sided tape and coated with a gold layer (40–50 nm), under high vacuum mode.
Fourier transform infrared spectroscopy (FTIR)
An IR spectrometer (Bruker Vector 22) was used to determine the FTIR spectra using the frequency range of 400–4000 cm-1. The samples were prepared by the KBr-disk method.
X-ray diffraction (XRD)
XRD measurements were performed, using reflection geometry, on a Rigaku, Tokyo, Japan, diffractometer, operated at a generator voltage of 40 kV, a current of40mA and a goniometer speed of 0.02 (2u)/s, and the XRD patterns were recorded in the reflection mode in the angular range 5–50° (2u) at the ambient temperature. The relative crystallinity index was calculated based on the calculus of amorphous area (Aa) and crystalline areas (Ac).
Rc = Ac/(Ac+Aa)
Rc= relative crystallinity; Ac = crystalline area; and Aa = amorphous area in the XRD pattern.
Results and Discussion
Proximate Composition of Sample Flours
The results are as shown in Table 1. The cassava flour had the highest content of carbohydrate (82%) while the Bambara nut was significantly (P<0.05) the lowest. The differences in the carbohydrate composition of all the sample flours were significant (P<0.05) with maize flour having more carbohydrate content (75%) than millet flour (69%).
The significant decrease (P<0.05) in the carbohydrate composition of millet flour could be attributed to the dilution effect resulting from increased moisture content compared to the maize flour which had more carbohydrate content but significant decrease (P<0.05) in moisture. This postulation is premised on the fact that maize and millet flour showed similar structural conformation as seen on the FTIR-Spectroscopic peaks (Figures 6 and 8). However, the SEM (Plate 3) showed that maize flour contained more starchy materials which may have resulted to the high content of the carbohydrate in the sample compared to the millet flour. It may be inferred that soaking of the maize and millet flours led to activation of α-amylase enzymes which led to improved protein in the flours. However, since millet contained more α-amylase in the intact structure of the starch granules which were separated microscopically from other constituents in the structure, there was observed significant increase in the protein content compared to that of the maize flours. This postulation may have resulted to comparable protein content between millet and wheat flours, although they were expectedly significantly lower in protein content compared to the bambara nut flour which is legume flour. Cassava ranked lowest in protein composition but was however significantly higher when compared to local cassava flour varieties which was 1.2% as reported by Sandoval and Fernandez and Ikegwu et al. [2] who reported that a cassava starch contained 0.01% protein content.
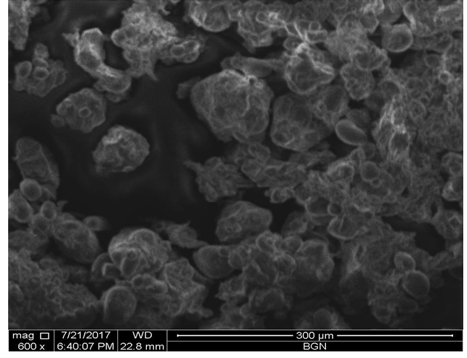
The SEM showed that the α-amylase activity of the enzyme is more pronounced in the millet flour which could be due to the concentration of enzymes in the soft endosperm of the kernels shown in the form of deep indentations in the starch granules. The high concentration of enzymes in the starch granules led to significant increase (p<0.05) in the protein content of millet flour in relation to the maize flour which had seldomely impregnable or less water hydration characteristics in the starch granules.
Values are means of triplicate determinations ±standard deviation. Means on the same column with different superscript differ (p < 0.05) significantly.
Table 1: Proximate compositions of raw Sample flours.
|
Samples |
Carbohydrate (%) |
Moisture (%) |
Ash (%) |
Crude fat (%) |
Crude protein (%) |
Crude fiber (%) |
|
MLF |
69.90±0.37d | 11.77±0.08a | 0.73±0.11b | 3.46±0.37c | 12.71±0.16b | 1.45±0.03b |
|
BGN |
57.80±0.06e | 5.04±0.13e | 4.04±0.12a | 5.50±0.08a | 23.54±0.13a | 4.10±0.01a |
|
MZF |
75.33±0.33c | 7.49±0.04b | 0.36±0.06c | 4.56±0.48b | 11.08±0.08c | 1.19±0.03c |
|
WHF |
78.23±0.22b | 5.66±0.06d | 0.72±0.04b | 1.75±0.03e | 12.98±0.23b | 0.67±0.02d |
|
CCF |
82.02±0.24a | 5.89±0.04c | 0.71±0.06b | 2.69±0.08d | 7.45±0.11d | 1.25±0.04c |
Keywords: MLF = millet flour; BGN = bambara nut flour; MZF = maize flour; WHF = wheat flour; CCF = cassava flour
The moisture content of the processed flour samples ranged from 5.04-11.77%. The moisture content of the millet flour was significantly the highest (P<0.05). This is followed by the maize flour, cassava flour, wheat flour and then, the Bambara groundnut flour. Comparatively, it would have been expected that the dilution effect of moisture in the millet flour would had led to consequent decrease in protein content of the sample in relation to the maize flour. This assumption is conversely the opposite due to the effect of soaking and structural differences as seen both in the FTIR-Spectroscopic studies, X-ray diffraction analysis and SEM microscopic studies. The imbibition of moisture during soaking led to increased hydration in millet flour. Furthermore, increased concentration and activity of α-amylase enzymes led to improved protein content as a result of protein-lipid linkage outside the starch granules of the millet flours that enhanced retention of moisture during drying and increased protein content. The low content of moisture in the wheat flour purchased from Dangote Company may be attributed to the effect of commercial production considerations where intention of the producers were to provide flours that can store for a longer duration before purchase by service industries or before spoilage. It may also be due to added fortificants which formed a homogenous mix with the flour, imbibing moisture and thus decreased the moisture content of the commercial product. The bambara nut flour (5.04%) was significantly the lowest (p<0.05) in moisture content.
The ash content of the samples ranged from 0.36% - 4.04%. There were significant variations (p<0.05) in the ash content of the samples, with bambara nut flour having the highest ash content (4.04%). The ash content contributes significantly to the quality of flour products. According to Chen and Yang, flour mills supplies low ash flour to noodle manufacturers in order to obtain bright and white noodles that remains stable in colour when stored fresh for 1 or 2 days. It had been reported that the US Hard White (HW) wheat were considered a suitable raw material for milling white salted noodle flours in Taiwan due to the fact that the colour had a lower correlation with flour ash compared to either the HRS or HRW wheat flour ash. Good (2002) posited that US HW wheat flour ash content did not show significant correlation with AE (r = 0.03, P>0.05, N = 12). In the meantime, the commercial range for acceptability of wheat flour for noodle production had been reported to be from 0.36 – 0.75% with an average of 0.52% processed on 14% moisture basis. It must therefore be stressed that the grain flours and cassava flour had ash content that are within the internationally accepted standard, especially in Taiwan for production of white salted noodles. The bambara nut flour had ash content (4.04%) that was too high to be considered (as it may cause changes in colour with time) for noodle production. Therefore, composite flour formulation that had BGN flour may have poor stability in colour during storage. This is because flour ash content associates closely with less brightness and more visible bran specks in flour products. However, in Nigeria, where white salted noodles are rarely produced, and bleaching agent (colourant) are frequently used in noodle production, the inclusion of BGN may be necessary for its high content of protein and crude fat. Additionally, significant increase (P<0.05) in the ash content of the flour may not be unconnected with increase in the mineral constituents in the pericarp and aleurone layers of the BGN. The normal ranges of the ash content in the other flours are therefore indication that there is minimal starch damage when they were milled. Research had shown that starch damage affects noodle cooking quality such as increase in cooking loss, gumminess of the noodle surfaces while noodles becomes less firm. Increase in water absorption and agglomeration of fragments in the mixer are also common in noodles produced from flours with high content of damaged starch. The content obtained for two varieties of cassava flours by Sandoval and Fernandez were 1.73% and 1.25%. The proximate composition of bambara nut obtained by Igbabul et al. [3] were ash (3.49%), moisture (10.01%), protein (16.44%), fat (5.75%), fiber (1.45%) and carbohydrate (62.87%).
There were significant variations (p<0.05) in the fat content of the sample flours. The BGN had the highest fat content (5.50%) while wheat flour was significantly (p<0.05) the lowest. Almost the same trend was observed in the fiber content of the samples. Conversely, significant variation was not observed (p>0.05) in the fiber content of samples MZF and CCF while sample BGN had the highest fiber content compared to either samples MZF and CCF , even as BGN sample possessed the highest fiber content. The result also showed that the dry matter (energy) values (Kcal/100g) of the samples had significant differences (P<0.05), with MLF been the least in the dry matter (kcal/100g) content.
The fat content of flours had not been considered as quality criterion in noodle production. In this study, it would be appropriate to correlate the fat content of the composite flours with the quality attributes of the noodles than the single strength processed flours which contributed only a proportionate portion to the production of the noodle. In the meantime, it would be necessary to state that the significant increase (p<0.05) in the fiber as well as fat contents of the BGN, including the dry matter posits it as a rich food product needed for national food security. Formulation of products with BGN would be necessary to augment the protein needs of the population.The results obtained in this research differed significantly from the results reported by Oladunmoye et al. that 100% cassava starch contained 1.0% fat and 362.8 energy (Kcal/100g) but nearly equal to the result obtained by Sandoval-Aldana et al. that cassava flour contained 0.35% fat and 2.98% crude fiber. Tharise et al. showed that cassava flour had 8.51% moisture, 1.06% ash, 4.98% protein, 0.65% fat as well as 2.62% fiber in its composition. This current research could also be compared to the work of Igbabul et al. [3] who reported that BGN contained 3.49% ash, 10.01% moisture, 16.44% protein, 5.75% fat, 1.45% fiber and 62.87% carbohydrate. In essence, the 5.75% fat content reported by Igbabul et al. [3] could be compared favourably with this current result. It may be argued that the 16.44% protein content obtained by the researchers was due to the dilution effect of moisture, since current research had half of the moisture content contained by bambara nut in the work of Igabul et al. [3] but contained a protein content of 23.54%. Arguably, the significant differences in the proximate compositions of the various flours could be attributed to the species/variety, soil type, environmental condition as well as biotechnology retooling.
Thermal Properties
Differential Scanning Calorimetry
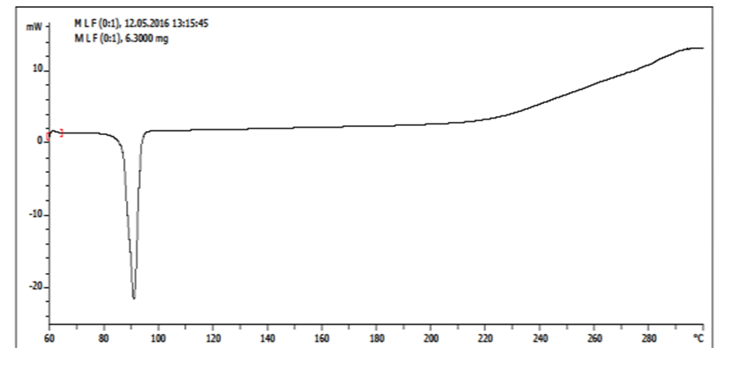
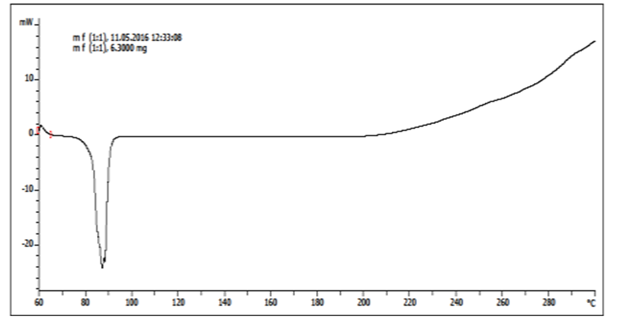
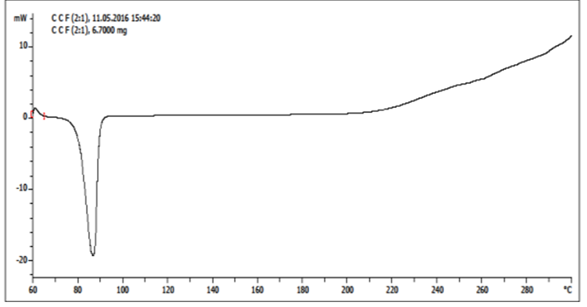
The DSC is an important consideration when birefringence is due to molecular orientation in amorphous regions or is absent due to crystallites being too small and randomly oriented. The DSC thermograms of starch gelatinization are shown on figures 1-5, and the thermal parameters were given in Table 2. The gelatinization temperatures (To, Tp, Tc, and Tr) of the flour samples showed that the gelatinization temperatures of cassava flour were lower than that of the other samples but the gelatinization range of CCF was wider than that of the other flour samples. The enthalpy values for CCF, MZF, MLF and WHF were 6.37Jg-1, 27.84Jg-1, 0.80Jg-1 and 39.07Jg-1, respectively. The enthalpy of gelation values of starches are affected by granule shape and the relative degree of crystallinity. The low values of gelatinization temperature in CCF reflects the presence of abundant amylopectin chains while higher values seen in MZF, MLF, and WHF are indicative of lower values of short amylopectin chains. Aldan and Quintero research on cassava flour noted that the gelatinization temperatures of cassava flour were 60.99, 66.14 and 69.91oC for onset, peak and completion temperatures for cassava obtained from a small factory while a cassava obtained from an industrial layout showed gelatinization temperatures of 66.01, 71.00, and 77.22oC for onset, peak and conclusion temperatures, respectively. It may be adduced that age, location and soil characteristics, as well as processing conditions may affect the gelatinization temperatures of flours/starchy foods. The results obtained in this research differed with the work of Aldana and Quintero on the endothermic enthalpy changes of the cassava flour which showed that the enthalpy change (Jg-1) was 7.75.
High values of enthalpy of gelatinization are associated with high levels of amylose in starches as seen in WHF and MZF flours. According to Jane et al. and Abubakar et al., high amylose in starches gives high enthalpy changes. This postulation has been countered by some researchers that situations occur whereby a decrease in amylose may experience an increase in enthalpy; implying that other parameters, in addition to amylose may influence the enthalpy of gelatinization, such as crystallinity, intermolecular bonding and treatment conditions. Furthermore, flours with lower onset (To) and completion (Tc) temperatures have a greater capacity to hydrate and gelatinize than ones with higher onset and completion temperatures.
Liu et al. asserted that all starches exhibited a single endothermic transition between 70 and 95oC for starch gelatinization. Himeda et al. established that the gelatinization temperatures and enthalpy (ΔH) increased significantly (p<0.01) with increase in maturity of starches/starch flours from the same raw material, in linear order. Similarly, researchers had equally reported similar behaviors for Trapaquadrispinosa Roxb and Taro, respectively. A different result for the gelatinization temperature of potatoes was obtained by Liu et al. and Huang et al.
Table 2: Thermal Properties of Processed Flours.
|
Sample |
Thermal Properties |
||||
|
To (oC) |
Tp(oC) |
Tc (oC) |
Tr (oC) |
ΔH (J/g) |
|
|
CCF |
79.85±0.30 | 86.02±0.05 | 89.67±0.20 | 9.82±0.01 | 6.37±0.00 |
|
MZF |
82.42±0.11 | 86.35±0.10 | 90.41±0.03 | 7.99±0.00 | 27.84±0.02 |
|
MLF |
86.36±0.02 | 90.26±0.08 | 95.44±0.04 | 9.08±0.03 | 0.80±0.01 |
|
WHF |
84.51±0.01 | 87.94±0.03 | 91.92±0.01 | 7.41±0.00 | 39.07±0.01 |
MLF = Millet flour; BGN = Bambara nut flour; MZF = Maize flour; WHF = Wheat flour; CCF = Cassava flour;
Figure 1: DSC thermograms of Processed Millet Flour.
The differential scanning calorimetry gave a clear and vivid explanation on the type of annealing treatment required to develop specific gel and texture characteristics; and for industrial application for the monitoring of product variation to reveal processing conditions that may anneal or temper the flour or starchy material. Amylose-lipid complexes and gelatinization of flour starch are known to influence the water penetration of starchy granules, resulting in the increase of temperatures for starchy products’ swelling or the gelatinization temperatures. Additionally, all the flours showed several endothermic peaks as the processing temperatures increased. Consequently, the enthalpy for the melting amylose-lipid complex (ΔH2) was also increasing, leading to raised formation of total complexes as the processing temperatures increased. Conversely, the sample flours exhibited different glass transition temperatures.
Figure 2: DSC Thermograms of Processed Wheat Flour.
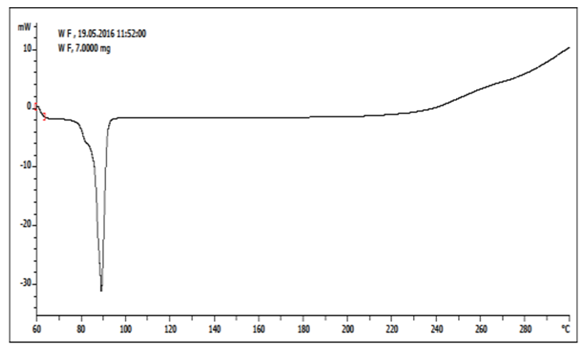
In this study, the DSC of millet flours showed endothermic peaks at 86.360C, 90.26oC and 95.440C.More peaks were also observed at 2300C and 2700C. The trend observed in the millet flour DSC endothermic peak was similar to the results obtained for wheat flour, cassava flour and maize flour. However, reduced sharpness in gelatinization endotherm was more pronounced in the wheat flour compared to the other flours. The gelatinization endotherm on the DSC thermograms resulted from the starch/lipid as well as protein complexes. The wheat flour, though low in lipid content, had more protein content than other native flour and thus contributed significantly to the increased depression of the DSC endotherm. Other researchers had only reported on the amylose/lipid complex without recourse to the effect of protein on the DSC endotherm of samples.In the main time, this research showed that the processed flours had different gelatinization temperature but had almost the same molecular structure as shown by the endothermic peaks, except the BGN flour.
Figure 3: DSC Thermograms of Processed Maize Flour.
Acevedo et al. reported that differences in flour thermal transition could be as result of differences in shape, size as well as in the distribution of starch granules in the flours. Live et al.equally attributed these differences to amylose/amylopectin ratio, internal arrangement of starch fractions within granule, different protein interactions and infractions between starch, protein and lipids.
Figure 4: DSC Thermograms of Processed Cassava Flours.
According to Henshans et al. changes in starch gelatinization, protein denaturation and changes in protein–starch interactions could result to peaks at the lowest temperature. Further heating beyond the 900C for all the processed flours showed endothermic stability which were altered at temperatures above 2200C at which glass transition (Tg) temperatures were observed. The processed flours exhibited more two peaks between 230oC and 290oC. These peaks could be explained based on metal chelating complexing actions due to evaporation of water from the starchy macromolecule as well as the oxidative degradation and deacylation. Conformational changes in the starch structure due to evaporation of water leading to thermal instability may have contributed to the endothermic peak between 220oC – 230oC while the exothermic peak between 270oC – 300o C could be attributed to bridging action through metal ion that may lead to thermal stability. In the characterization of chitosan using DSC by Screenivasan, Hg+ complex peaks were observed endothermically at 200oC, 220oC and 242oC while the Cu2+ complex demonstrated a single peak at 203oC that was attributed to crystalline-phase formation.
Structural Properties
Scanning Electron Microscopy (SEM) of Samples The scanning electron micrograph of the raw sample flour starches were as shown in Figure 1. The cassava starch granules had oval and rounded shapes with relatively large size and smooth surfaces. Some of the external surfaces of the cassava starch showed imperfections such as fissures (Plate 4). The fissures may be attributed to the effect of grinding/milling in a plate mill which led to damage in starch structure. The diameter of the granules also ranged in size from 5µm to 20µm. The starch granule from cassava starch showed characteristic morphology of improved variety of starches compared with native cassava varieties under electron microscopy. Other researchers have established that the starch granules from all cassava cultivars were circular in shape and had some concave-convex characteristics. According to Soccol et al., cassava flours are formed by smooth and spherical amylaceous granules of heterogeneous sizes (5-15µm). The spore formations on cassava flour are within the axis of cassava starch which it feeds on, and thus, takes the shape of the starch.
In the microstructure of the processed millet flour, there is orderly crystalline arrangement of starch granules whereas other constituents of the flour changed into a homogenous amorphous mass. The granules had varying sizes which ranged from spherical to polygonal; possessing intermediate types, several granules with deep indentations that are as a result of protein bodies. The spherical starch granules of the millet showed evidence of enzyme attack that could have been caused by α-amylase that was activated during the period of soaking. It had been inferred by Badi et al. that such preferential attack of the spherical starch granules might had been from enzymes that were concentrated in the soft endosperm of the kernels or from soft endosperm starch granules being susceptible to enzymatic degradation.
Plate 1: SEM of WF.
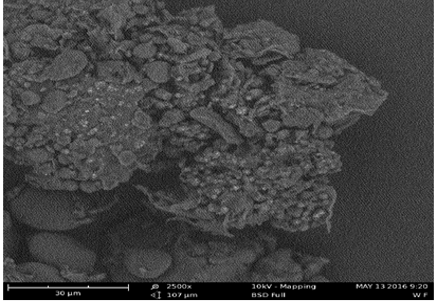
Plate 2: SEM of MLF.
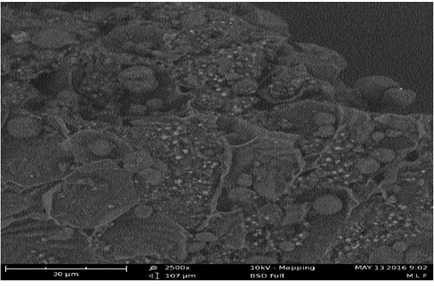
The morphology of the maize starch flour differed from all the other starches in that the starch granules are polyhedric and shaped. The axial diameters ranged from 3µm to 8µm. The starch granules were compact with some of the starch granules exhibiting somewhat of elliptical shape. The result is in agreement with works of other researchers.
Plate 3: SEM of MZF.
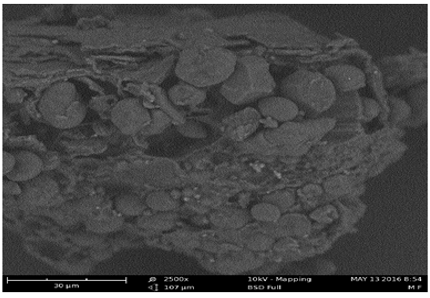
Plate 4: SEM of CCF.
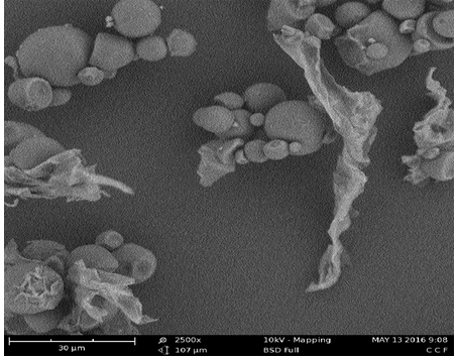
Plate 5: SEM of BGN.
Fourier Transform Infra-Red (FTIR) Spectroscopy Studies
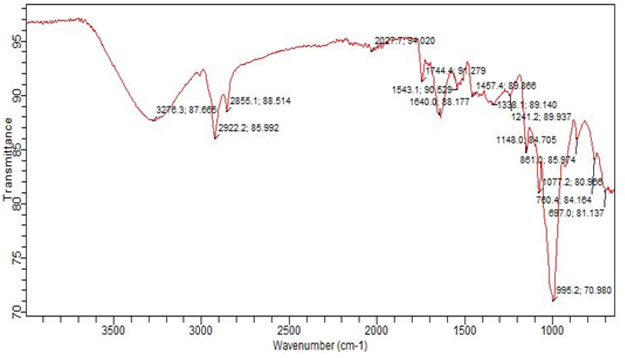
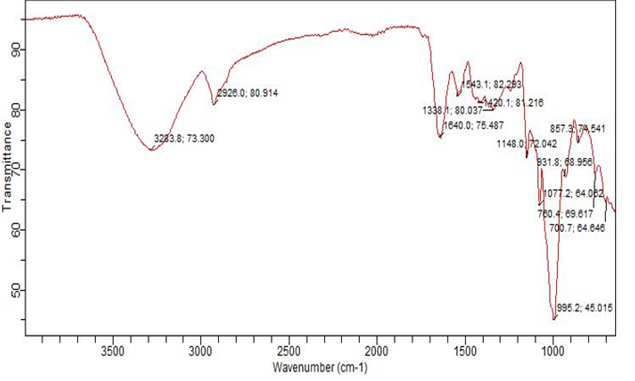
IR is claimed to be sensitive to short-range order, proposed to be the double helix content in starch. X-ray diffraction provides statement about long-range order such as packing of double helixes into ordered arrays. Correlation between IR and X-ray diffraction are obtained for mixtures of amorphous and crystalline starches. The IR spectrum of starch has been shown to be sensitive to changes in structure on a molecular (short-range) order, and retrogradation processes as well as the presence of moisture. According to Sevenou et al., the IR absorbance or transmittance band of 1047 cm-1 is sensitive to the amount of ordered or crystalline starches, and the band at 1022 cm-1 is characteristic of amorphous starch. In this study, the ratios of heights of bands between 800 – 1200 cm-1 expresses the amount of ordered starches to amorphous starches. It has been postulated that high values of the ratios of absorbance is indicative of disorderliness in ordered structure of gelatinized starches while lower values leads to lower amounts of ordered starch.
The Table 3 showed the level of orderliness observed in the ordered structure of the flour samples. Millet flour was shown to have more order in the ordered structure than the other flour samples. It was also observed that the level of orderliness decreased at higher wavenumbers.
Table 3: Level of orderliness in gelatinized starches.
|
Starch flours |
Ratio of absorbance |
|
|
(1148.2/1077.2 |
1077.2/995.2 | |
|
CCF |
1.19 | 1.81 |
|
MLF |
1.046 |
1.141 |
|
MZF |
1.186 | 2.015 |
|
WHF |
1.125 | 1.42 |
MLF = Millet flour; BGN = Bambara nut flour; MZF = Maize flour; WHF = Wheat flour; CCF = Cassava flour;
The high values, according to Yu et al. could be a consequence of ordered structure in their external region. These large values also propose that there could be different polymorphs in the ordered structure which contributed to the high intensities obtained. Cassava flour, being very high in the two regions showed that it possessed more ATR-FTIR spectroscopy spectral bands in both regions compared to either the millet or wheat flours while maize had the highest polymorphs at the lowest wavenumbers.
Figure 5: FTIR Spectroscopy of Processed Cassava flour.
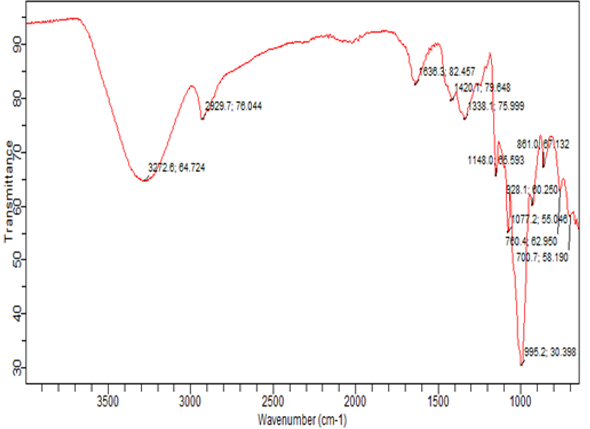
This assumption could be further confirmed from the DSC which showed that the flour structure may possess A+V-type polymorphs. Zhang et al. used the FTIR spectra to obtain height ratios of 1.42 for rice starch. However, since the moisture content of the flour samples has effect on the degree of disruption of molecular order in starch, the differences in the spectral ratios could be associated with the moisture content of the samples, type of raw materials and or the effect of processing condition.
Figure 6: FTIR Spectroscopy of Processed Millet Flour.
In industrial productions, food processes are monitored online for different quality parameters for consistency in quality. Arising from the concern to produce food products which has correct and consistent quality criteria needed by consumers, monitoring of flours from different grain variety, as well as the incorporation of legume flours into the product becomes more important. FTIR-Spectroscopy, as a fast, repeatable simple technique applied in food industries are used for flour quality control and consequently the quality of the flours final products. FTIR-Spectroscopy is both qualitative and quantitative for food macromolecules where it is applied for the structural analysis of proteins, fats, carbohydrates as well as water. The fundamental principle of FTIR-Spectroscopy is the absorption of infra-red radiation due to the oscillation of molecules.
Figure 7: FTIR Spectroscopy of Processed Wheat Flour.
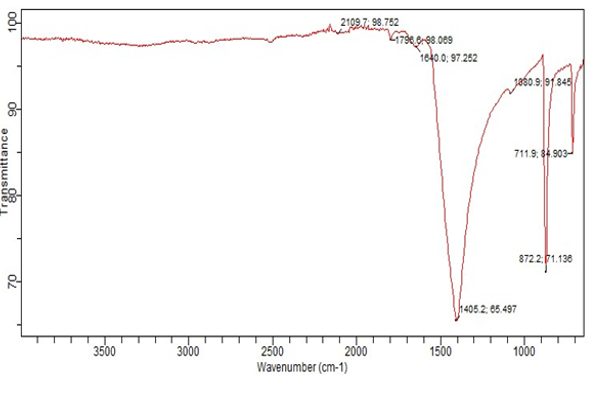
The usual attenuated total reflection (ATR) Fourier Spectral of wheat flour, cassava flour, maize and millet flours are as shown on Figures 5-8. The spectral features of the protein absorbed were strong amide I and II bands that were located at 1600 cm-1, 1620 cm-1, 1700 cm-1 and 1720 cm-1, respectively. The amide I absorption could be explained in terms of the vibrational stretching of the C=O bond while the amide II absorption bands were as result of the coupling of the bending of the N-H bond and the stretching of the C-N bond. Liu et al. explained that starches exhibits a series of overlapping intense band peaks at the region of 1180-953 cm-1 while the spectral bands between 1715 – 1484 cm-1 is used to represent protein in the area of the amide I and II bands. In this study, the ring skeletal vibrations were observed within 1640-1148 cm-1 while the C-H bending vibrations were observed between 991.5-857.3 cm-1. The presence of two strong bands near 1420 cm-1 and 1338-1 cm in the cassava flour attenuated total reflection (ATR) Fourier transform infra-red spectroscopy band showed that cassava flour contained nitro groups.
Figure 8: FTIR of Processed Maize Flour.
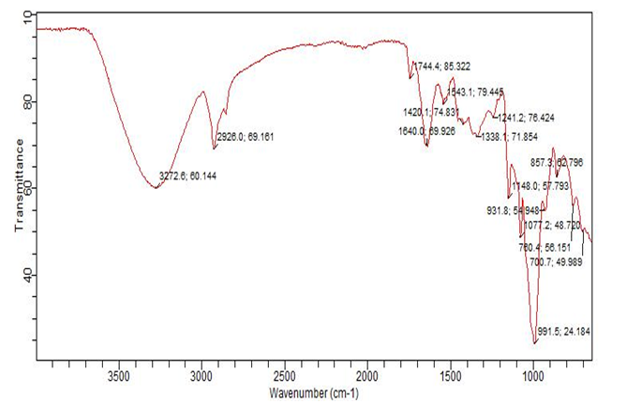
Furthermore, the nitro group is conjugated with benzene ring since the absorption appeared at the lower wavenumbers. In addition, two bands were observed between 3300 cm-1 and 2926 cm-1 in all the spectral bands of the native starches. The sp2-hybridized C-H bonds lies between 3100 – 3000 cm-1 while the sp3-hybridized C-H bonds are between 3000 – 2850 cm-1. Therefore, the aromatic ring is responsible for the absorption due to the sp2 C-H stretching vibrations. The N-H band at 3272.6 cm-1 was weak but broad in maize and cassava flours. This functional group was observed in wheat flour at 3283.8 cm-1, in millet at 3276.3 cm-1.
Figure 9: FTIR of Processed BGN Flour.
Acknowledgement
We acknowledge the Department of Food Science and Technology, Ibrahim Badamasi Babangida University for the provision of a conducive environment for the research to take place. Our thanks go to the chemical engineering Department of Ahmadu Bello University, Zaria for making their equipment available for the FTIR and SEM studies. Mr. Mohammed, the Chief Laboratory Scientist of the Nigerian Cereal Research Institute is acknowledged for the analysis of the proximate and anti-nutrient parameters.
Declaration of interest
The authors declare that there are no conflicts of interest.
References
- AOAC (2010) Official Methods of Analysis, 20th ed. Association of Official Analytical Chemists, Washington, DC.
- Ikegwu T.M, Owuamanam C.I, Ayim M.M (2015) Proximate and physicochemical properties of modified cassava, yam and rice starches. Proceedings of the 1st International Conference on Biosciences Research, Awka, Nigeria, May 25-27.
- Igbabul B, Adole Doris, Sule S (2013) Proximate Composition, Functional and Sensory Properties of Bambara Nut (Voandzeia subterranean), Cassava (Manihotesculentus) and Soybean (Glycine max) Flour Blends for “Akpekpa” Production. Current Research in Nutrition and Food Science 1: 147-155.
- Osman A.M.A, Hassan A.B, Osman G.A.M, Mohammed N, Rushdi M.A.H, et al. (2014) Effects of gamma irradiation and/or cooking on nutritional quality of faba bean (Viciafaba L.) cultivars seeds. Journal of Food Science and Technology.
- Kirk R.S, Sawyer R (1998) Fruit Pearson Chemical Analysis of Foods (8thedn.). Longman Scientific and Technical. Edinburg. Pp. 211-212.
- Kehrer J.P (1993) Free radicals as mediators of tissue injury and disease. Critical Reviews in Toxicology 23: 21-48.
- Abdel-Haleem W.H, El Tinay A.H, Mustafa A.I, Babiker E.E (2008) Effect of fermentation, malt-pretreatment and cooking on antinutritional factors and protein digestibility of sorghum cultivars. Pakistan J. Nutr. 7: 335-341.
- Abdel-Rahaman S.M, Babiker E.E, El-Tinay A.H (2005) Effect of fermentation on antinutritional factors and HCl extraction of minerals of pearl millet cultivars. J. Food Technol. 3: 516-522.
- Abedel-Hady A.S, Hassan A.B, Ali I.M, Babiker E (2005) Antinutritional factors content and availability of protein, starch and mineral of maize (Zeamayslinnanus) and lentil (Lens culinaris) as influenced by domestic processing. J. Food Technol. 3: 523-528.
- EL Hag M.E, El Tinay A.H, Yousif N.E (2002) Effect of fermentation and dehulling on starch, total polyphenols, phytic acid and in vitro digestibility of pearl millet. Food Chem. 77: 193-196.
- Osman M.A (2011) Effect of traditional fermentation process on the nutrient and antinutrient contents of pearl millet during preparation of Lohoh. Journal of the Saudi Society of Agricultural Sciences 10: 1-6.
- Aberoumand A (2012) Screening of Phytochemical Compounds and Toxic Proteinaceous Protease Inhibitor in Some Lesser-known Food Based Plants and Their Effects and Potential Applications in Food. International Journal of Food Science and Nutrition Engineering 2: 16-20.