Artifactually Low Hemoglobin A1C in Diabetic Patients with Hemoglobin E Disorder: Surin Hospital, Thailand
Passorn Sueyanyongsiri1*, P Tangbundit1, S Sueyanyongsiri1, S Bunmee1, P Khansri1
1 Surin hospital, Affiliated Institutes of Suranaree University of Technology, Thailand.
*Corresponding Author: Passorn Sueyanyongsiri, General medicine, Surin Hospital, 68, Lukmuang Road, muang surin, Surin, Thailand, 32000, TEL: +6644511757; FAX: +6644511757; E-mail:drpassorn@gmail.com
Citation: Passorn Sueyanyongsiri, P Tangbundit, S Sueyanyongsiri, S Bunmee, P Khansri, et al. (2019) Artifactually Low Hemoglobin A1C in Diabetic Patients with Hemoglobin E Disorder: Surin Hospital, Thailand. Allergy drugs clin immunol 3:117.
Copyright:© 2019 Passorn Sueyanyongsiri, et al. This is an open-access article distributed under the terms of the Creative Commons Attribution License, which permits unrestricted use, distribution, and reproduction in any medium, provided the original author and source are credited.
Received date: September 10, 2019; Accepted date: September 20, 2019; Published date: September 24, 2019.
Abstract
Background: A decreased life-span of erythrocytes is associated with lower concentration of hemoglobin A1C (HbA1c). This research aims to study effect of hemoglobin E disorder on HbA1c level of diabetic patients in Surin Hospital.
Methods: A cross-sectional study was conducted from 2009 to 20016. Patient’s profile, fasting plasma glucose and HbA1c level were collected and divided in hemoglobin E trait (HbEA), hemoglobin E homozygous(HbEE) group and control group. Each sample arm was classified into eight strata according to blood glucose level to compare HbA1c level in each subgroup. HbA1c in each subgroup was compared with fasting plasma glucose measured before breakfast. Statistical analysis was carried out. Descriptive parameters are presented as means with standard deviations, or as percentiles. One-way Anova analysis was used to compare the mean values among the group defined by different levels of blood glucose and HbA1c, follow by independent T-test in control group and hemoglobin E group. Gaussian regression analysis was used for univariable and multivariable analysis. A p-value < 0.05 was considered statistically significant.
Results: During 2009-20016, 81 patients were HbEE, 193 were HbEA and 353 patients were in the control group. There were 1887 blood tests consisting of 691 in control group 596 in HbEA group and 580 in HbEE group. There were no significant differences in regard to age, sex and FPG among the groups. The hematocrit was significantly lower in HbEE group. There was no significant difference in the mean blood glucose concentration of the patients in all groups (P=0.566) 150 ± 85.7SD, 151 ± 50.1SD and 146 ± 45.9SD. In addition, the mean HbA1c concentration in hemoglobin E disorder group (6.94 ± 0.96 SD, 6.48 ± 1.17 SD) was very strongly significantly (P<0.001) lower than control group (7.15 ± 1.24 SD). Difference in individual group, homozygous hemoglobin (HbEE) produced a relationship of HbA1c (%) = 4.335+0.016FPG (mg %), HbA1c (%) = 4.798+0.016FPG (mg %) in hemoglobin E trait (HbEA) and HbA1c (%) = 4.990+0.016FPG (mg %) in negative DCIP (N). The effect of FPG and hemoglobinopathy to HbA1c by multivariable regression was HbA1c (%) = 5.25+0.014FPG (mg %)-0.23HbEA-0.70HbEE.
Conclusion: Since HbA1c levels is presently the best indicator of long term glycemic control. With similar fasting plasma glucose, hemoglobin E homozygote is associated with lower HbA1c level.
Keywords
Diabetes mellitus, Hemoglobinopathy, Hemoglobin A1C, HbA1c.
Introduction
Previous large prospective research trials in diabetic mellitus patients have demonstrated that HbA1c levels are directly related to the risk of diabetic complications [1-3]. The most important factor that determines HbA1c concentration is a long-term blood glucose level which makes HbA1c be a standard for monitoring in long-term glycemic control in diabetics patients [4-6]. The data from some research have shown that intensive glucose control can lead to the increasing of hypoglycemic which also attacks in diabetic patients [7].
In diabetic patients, there are normal hemoglobins in which HbA1c values strongly correlate with blood glucose level. However, many studies have shown that there is the decreasing in erythrocyte life-span such as the observation of hemolytic anemia, which is associated with the lower concentration of HbA1c [8-10]. This has been suggested to be because HbA1c is correlated with the developmental stage of erythrocytes [8-9]. The concentration of minor hemoglobins in young’s erythrocytes was found to be lower than older erythrocytes [11]. Therefore, HbA1c concentration has been proposed as a diagnostic parameter in anemia which is associated with short erythrocyte life-spans [10].
More than 700 forms of hemoglobinopathy or abnormal hemoglobin variants have been reported [12-16]. Hemoglobin E disorder is the most prevalent hemoglobinopathy in Surin province, Thailand [16-17]. Hence, diabetic patients who have concomitant hemoglobin E disorder are also frequently encountered [17]. Hemoglobinopathies are routinely screened in the diabetic clinic at Surin hospital, Thailand. HbA1c is a standard for monitoring long-term glycemic which controls in hemoglobin E disorder diabetics. However, alterations of HbA1c in diabetes mellitus due to the factors also affect hemoglobin levels which have not been extensively investigated. This study aims to determine the relationship between the HbA1c level and fasting plasma glucose in endemic area of hemoglobinopathy.
Aim of the Study
This study was carried out to determine the relationship between hemoglobin E disorder and HbA1c in diabetic patients.
Material and Methods
This cross-sectional study was approved by the institutional review board and conducted in the diabetic clinic at Surin Hospital since January, 2009 to December, 2016. Among these 81 patients, there were HbEE which the blood sample was also taken for HbA1c once per year. Informed consent was obtained from all subjects. The sample size of 588 samples was calculated from the average and the variance which obtained from a previous study in 2006 [10]. Subjects were confirmed diabetic patients who already had been treated either with insulin, oral hypoglycemic drugs or a physician-prescribed diet. In addition, the analysis measurements from three sets of data were also used. The hypothesis at the same level of FPG, HbA1c was no difference because there is no effect in hemoglobin E disorder patients.
For the laboratory measurements, a blood sample was taken in the morning after an overnight fast and there was a test for fasting plasma glucose, dichlorophenol-Indolephenol (DCIP) and HbA1c. Subjects were classified into one of three groups; included, negative DCIP (N), hemoglobin E trait (HbEA) and homozygous hemoglobin (HbEE). When DCIP test was positive, hemoglobin typing was further done by Hb gold analyser (Drew Scientific Ltd.,England) by using low-pressure liquid chromatography(LPCL). HbA1c level was compared between groups. Base on the characteristic of FPG, HbA1c, complete blood count, hematocrit and creatinine, they were collected from the first visit of year 2009. The DCIP test was KKU-DCIP-clear reagent [18].
HbA1c was measured by using the turbidimetric inhibition immunoassay (TINIA) for hemolyzed whole blood (Cobas®, Roche Diagnostics, USA). Testing blood sugar levels compared among these three groups of diabetic patients. HbA1c in each subgroup was compared with fasting plasma glucose measured before breakfast. Statistical analysis was carried out. Descriptive parameters are presented as means with standard deviations, or as percentiles. One way Anova analysis was used to compare the mean values among the group defined by different levels of age, sex, hematocrit, blood glucose and HbA1c, follow by independent T-test in control group and each hemoglobin E subgroups. Gaussian regression analysis was used for univariable and multivariable analysis. A p-value < 0.05 was considered statistically significant.
Results
A total of 627 diabetic patients treated at the Surin hospital diabetic clinic were studied during the eight-year period from January 2009 to December 2016. Among these, 81 patients were HbEE, 193 were HbEA and 353 patients were in the control group. There were 1887 blood tests consisting of 691 in control group 596 in HbEA group and 580 in HbEE group. There were no significant differences in regard to age, sex and FPG among the groups. The hematocrit was significantly lower in HbEE group. Describes patient characteristics show in table 1.
Table 1: Characteristics of the patients at baseline.
| Variable | Control group | HbEA | HbEE | p-value* |
|---|---|---|---|---|
| Cases(n) | 353 | 193 | 81 | |
| Blood sample | 691 | 596 | 580 | |
| Age(years; mean, SD) | 60(10.9) | 58(10.6) | 60(10.4) | 0.1156 |
| Sex(Male: Female) | 0.43 | 0.46 | 0.38 | |
| FPG(mg/dl; mean, SD) | 150(85.7) | 151(50.1) | 146(45.9) | 0.5660 |
| HbA1c(%; mean, SD) | 7.15(1.24) | 6.94(0.96) | 6.48(1.17) | <0.001 |
| Hematocrit(%; mean, SD) | 39(5.2) | 38(4.4) | 32(4.1) | <0.001 |
FPG= Fasting plasma glucose; control group= negative dichlorophenol-Indolephenol; Hb EA= hemoglobin E trait; Hb EE= homozygous hemoglobin E; P-value
The three groups were not significantly different from each other with respect to age or sex, the mean age 60 years in control group versus 58 and 60 years in hemoglobinopathy groups (P=0.116). There was no significant difference in the mean blood glucose concentration of the patients in all groups (P=0.566) 150 ± 85.7SD, 151 ± 50.1SD and 146 ± 45.9SD. In addition, the mean HbA1c concentration in hemoglobin E disorder groups (6.94 ± 0.96 SD, 6.48 ± 1.17 SD) was very strongly significantly (P<0.001) lower than control group (7.15 ± 1.24 SD). Figure 1 show the normality test was not present as normal distribution, most of data in level 60-239 mg%, that why we have to separated in many strata and excluded very low and very high HbA1c. Totally 201 blood exam were excluded (15.1%). Similarly, the mean HbA1c concentration in 6 strata was lower than control group, as presented in table 2,3.
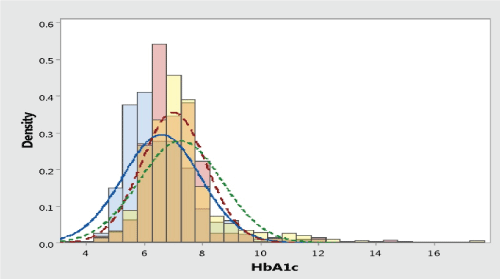
Table 2: Combination of fasting plasma glucose and HbA1c in hemoglobin E and negative DCIP group by independent T-test.
| Fasting plasma glucose ( mg% ) | HbA1c ( % ) | P-value | |
|---|---|---|---|
| Negative DCIP group | Hb EE | ||
| 80-99 mg/dl (4.4-5.5 mmol/l) | 6.86 ±0.86 SD | 5.98 ± 0.95 SD | <0.001 |
| 100-119 mg/dl (5.6-6.6 mmol/l) | 6.58 ± 0.99 SD | 6.18 ± 1.27 SD | 0.001 |
| 120-139 mg/dl (6.7-7.7 mmol/l) | 6.98 ± 8.12 SD | 6.17± 7.55 SD | <0.001 |
| 140-159 mg/dl (7.8-8.8 mmol/l) | 7.35 ± 1.43 SD | 6.60 ± 1.20 SD | <0.001 |
| 160-179 mg/dl (8.9-9.9 mmol/l) | 7.66 ± 1.45 SD | 6.69 ± 1.16 SD | <0.001 |
| 180-239 mg/dl (10.0-13.3 mmol/l) | 8.56 ± 1.90 SD | 7.58 ± 1.34 SD | <0.001 |
FPG= Fasting plasma glucose; control group= negative dichlorophenol-Indolephenol; Hb EA= hemoglobin E trait; Hb EE= homozygous hemoglobin E; P-value
Table 3: Combination of fasting plasma glucose and HbA1c in hemoglobin EA and negative DCIP group by independent T-test.
| Fasting plasma glucose (mg%) | HbA1c ( % ) | P-value | |
|---|---|---|---|
| Negative DCIP group | Hb EA | ||
| 80-99 mg/dl (4.4-5.5 mmol/l) | 6.86 ±0.86 SD | 6.35 ± 0.91 SD | <0.001 |
| 100-119 mg/dl (5.6-6.6 mmol/l) | 6.58 ± 0.99 SD | 6.70 ± 0.63 SD | <0.001 |
| 120-139 mg/dl (6.7-7.7 mmol/l) | 6.98 ± 8.12 SD | 6.89± 0.74 SD | <0.001 |
| 140-159 mg/dl (7.8-8.8 mmol/l) | 7.35 ± 1.43 SD | 7.00 ± 0.77 SD | 0.005 |
| 160-179 mg/dl (8.9-9.9 mmol/l) | 7.66 ± 1.45 SD | 7.2 ± 0.82 SD | 0.019 |
| 180-239 mg/dl (10.0-13.3 mmol/l) | 8.56 ± 1.90 SD | 7.77 ± 1.34 SD | <0.001 |
FPG= Fasting plasma glucose; control group= negative dichlorophenol-Indolephenol; Hb EA= hemoglobin E trait; Hb EE= homozygous hemoglobin E; P-value
Gaussian regression analysis was used, HbA1c and FPG summarized by patient, produced a relationship of HbA1c (%) = 4.98+0.014FPG (mg %). Among both hemoglobinopathic groups and negative dichlorophenol-Indolephenol (DCIP) group showed correlations with HbA1c = 7.19-0.33DCIP group (table 4). Difference in individual groups, homozygous hemoglobin (HbEE) produced a relationship of HbA1c (%) = 4.335+0.016FPG (mg %), HbA1c (%) = 4.798+0.016FPG (mg %) in hemoglobin E trait (HbEA) and HbA1c (%) = 4.990+0.016FPG (mg %) in negative DCIP (N), as presented in figure 2. The effect of FPG and hemoglobinopathy to HbA1c by univariable and multivariable regression was showed in table 5,6. Last model is HbA1c (%) = 5.25+0.014FPG (mg %)-0.23HbEA-0.70HbEE.
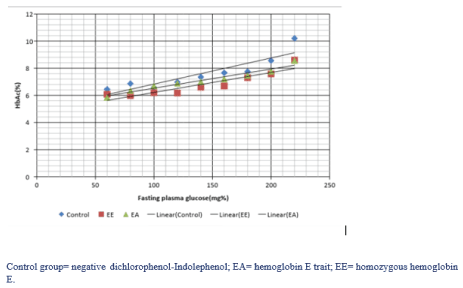
Table 4: Effect of fasting plasma glucose and hemoglobinopathy to HbA1c by Gaussian regression.
| Variable | Constant | Co-efficient | 95% Confidence interval | P-value |
| FPG | 4.98 | 0.014 | 0.012-0.015 | <0.001 |
| DCIP group | 7.19 | -0.33 | (-0.40)-(-0.27) | <0.001 |
Table 5: Effect of hemoglobinopathy to HbA1c by Gaussian regression compare with negative DCIP.
| Variable | Constant | Co-efficient | 95% Confidence interval | P-value |
| Group 1 Hb EA | 7.15 | -0.21 | (-0.34)-(-0.88) | 0.001 |
| Group 2 Hb EE | 7.15 | -0.67 | (-0.80)-(-0.55) | <0.001 |
Table 6: Effect of fasting plasma glucose and hemoglobinopathy to HbA1c by multivariable regression.
| Variable | Constant | Co-efficient | 95% Confidence interval | P-value |
| FPG | 5.25 | 0.014 | 0.013-0.015 | <0.001 |
| Group 1 Hb EA | 5.25 | -0.23 | (-0.34)-(-0.12) | <0.001 |
| Group 2 Hb EE | 5.25 | -0.70 | (-0.81)-(-0.58) | <0.001 |
Discussion
Surin province is located in the northeast of Thailand, near the Thai-Cambodian border. In this region, thalassemia and hemoglobin E disorder are more prevalent than other areas [14-15]. Therefore, the diabetic patients are often found to have concomitant hemoglobin E disorder with an estimate of approximately 30-50% of all diabetic patients, which also add a level of complexity in caring for these patients [14,16-17]. The American Diabetes Association (ADA) recommends HbA1c as the standard laboratory assessment of long-term glycemic control and efficient treatment of diabetic patients [4-6]. The HbA1c better correlates with complications than FPG. However, a factor that affects HbA1c level is a lifespan of the red blood cells [9]. In patients with hemoglobinopathies, the lifespan of red blood cell is shorter than normal which HbA1c may also be lower than usual [9-11]. For this reason, in American guidelines, self monitoring in blood sugar is recommended for using to monitor diabetic patients with abnormal Hemoglobin [4]. However, a study has shown that monitoring diabetic patients by using blood sugar may lead to aggressive blood sugar lowering interventions which causes the increasing of death rate [7].
For this reason, HbA1c should also be used for monitoring of glycemic control in diabetic patients with hemoglobinopathies to ensure the minimizing long-term diabetic complications while avoid hypoglycemic attacks. Nevertheless, it needs to take into the account of the confounding effect of shortened red blood cell lifespan [9]. HbA1c is the result of an irreversible non-enzymatic glycation of the beta chain of hemoglobins A. It is normally presented in circulating red cells because of the glycosylation reaction between hemoglobins and circulating glucose [8]. In the presence of excessive plasma glucose, the hemoglobins beta-chain increases glycosylated which makes the HbA1c be a useful index of long-term glycemic control [8]. The recommendations of glycemic goals for non-pregnant individuals are based on data of HbA1c. The goals of blood glucose are at the levels which appear to correlate with achievement of HbA1c less than 7% [4-6]. However, in some clinical situations, laboratory assessment using HbA1c may provide unreliable information. When the glycohemoglobin such as HbA1c result is inconsistent with a patient's clinical situation, conditions that affect red blood cell lifespan and hemoglobinopathies must be considered as possible causes. It is because normal values for HbA1c are based on individuals who have normal hematological profiles. For patients that HbA1c and measured blood glucose appear discrepant, clinicians should consider the possibilities of hemoglobinopathy or altered red cell turnover, and the options of more frequent and/or different timing of self-monitoring of blood glucose which combined with HbA1c monitoring [4]. This study found that hemoglobinopathies showed very strong correlations with HbA1c = 5.25+0.014FPG-0.25HbEA-0.70HbEE (mg %). HbA1c level in hemoglobinopathies patients were shown very strong significant lower in all strata level. The relationship between HbA1c and FPG is complex. Some studies have shown that high correlation between plasma glucose and HbA1c up to 80% [3]. In this study, the correlation is 80.5-94.5%. Nonetheless, FPG and HbA1c are not the only factors that used in monitoring but a holistic approach in tailoring care for each patient to prevent complications in the long term should always be kept in a priority.
HbA1c is the result of an irreversible non-enzymatic glycation of the beta chain of hemoglobin A. HbA1c is routinely used to assess long term glycemic control in patients with DM. It is normally present in circulating red cells because of the glycosylation reaction between hemoglobin and circulating glucose. In the pesence of excessive plasma glucose, the hemoglobin beta-chain becomes increasingly glycosylated, making the HbA1c a useful index of glycemic control.
These results clearly demonstrate that there is a relationship between the hemoglobinopathy and HbA1c in adult patients with type1 and type 2 DM. Although this correlation had been previously reports, authors have demonstrated it in diabetes patients in a clinical data. Our data are in accordance with the findings that the concentration of minor hemoglobins in young erythrocytes was found to be lower than that in the older erythrocytes. HbA1c concentrations in diabetic patients with hemoglobin E disorder was found lower than control group when compared to similar glycemic control level. In regression model, all groups were not different in slop. But they were different in constant or intercept, that mean HbA1c in three groups were different at base of value.
Several limitations are worth mentioning in this study. First, information on type hemoglobin in control group was not obtained. By incidence of hemoglobinopathy in Surin, there are some hemoglobinopathy in control group, we should undergo measurement. Second, in this study group, there are pale in hemoglobin EE, most of subjects are low hematocrit. By naturally, in asymptomatic anemic hemoglobinopathic patients were not tried to correct to normal value. Hematocrit level was not adjusted in multivariable regression. That is may be strong confounder and may effect to HbA1c level. This association must be investigated in long term outcome in patient groups, where the level of glycemic control can be further stratified and the correlation of HbA1c with hematocrit status can be determined. Finally, diabetic complication and duration of disease did not assess. Further study is needed to confirm that long term glycemic control in Hb EE DM patient should be lower than 6.17% as recommend.
Conclusion
HbA1c concentrations in diabetic patients with hemoglobin E should be interpreted with caution. HbA1c is lower than expected because of the artifactually low of HbA1c measurement. Self monitoring in blood sugar should be performed. Diabetic patients with hemoglobins E disorder should carefully use HbA1c level as an indicator for long-term glycemic control. Diabetic patients with unexpected by low HbA1c value should be identified hemoglobins variant.
References
- U.K. Prospective Diabetes Study Group: Intensive blood-glucose control with sulphonylureas or insulin compared with conventional treatment and risk of complications in patients with type 2 diabetes (UKPDS 33) 1998; Lancet 352: 837-853.
- Selvin E, Marinopoulos S, Berkenblit G, et al. (2004) Meta-analysis: glycosylated hemoglobin and cardiovascular disease in diabetes mellitus. Ann Intern Med 141: 421-431.
- Rohlfing CL, Wiedmeyer HM, Little RR, England JD, Tennill A, et al. (2002) Defining the relationship between plasma glucose and HbA(1c): analysis of glucose profiles and HbA(1c) in the Diabetes Control and Complications Trial. Diabetes Care 25: 275-278.
- American Diabetes Association (2019) Standards of medical care in diabetes 2019. Diabetes care 42: S1-S2.
- Schulz KF, Grimes DA (2005) Multiplicity in randomised trials I: endpoints and treatments. Lancet 365: 1591-1595. [crossref]
- Sacks DB, Bruns DE, Goldstein DE, Maclaren NK, McDonald JM, et al. (2002) Guidelines and recommendations for laboratory analysis in the diagnosis and management of diabetes mellitus. Clin Chem 48: 436-472. [crossref]
- The Action to Control Cardiovascular Risk in Diabetes (ACCORD) Study Group. Effects of intensive glucose lowering in type 2 diabetes. N Engl J Med 2008; 358: 2545-2559.
- Fitzgibbons JF, Koler RD, Jones RT (1976) Red cell age-related changes of hemoglobins AIa+b and AIc in normal and diabetic subjects. J Clin Invest 58: 820-824. [crossref]
- Weykamp CW, Penders TJ, Muskiet FA, van der Slik W (1993) Influence of hemoglobin variants and derivatives on glycohemoglobin determinations, as investigated by 102 laboratories using 16 methods. Clin Chem 39: 1717-1723.
- Sueyunyongsiri P (2008) Effect of Hemoglobin E disorder on Hemoglobin A1c in Diabetic patients. Med J Srisaket Surin Buriram Hosp 23: 637-643.
- Bunn HF, Haney DN, Kamin S, Gabbay KH, Gallop PM (1976) The biosynthesis of human hemoglobin A1c. Slow glycosylation of hemoglobin in vivo. J Clin Invest 57: 1652-1659. [crossref]
- Schneider RG, Hightower B, Hosty TS, Ryder H, Tomlin G, et al. (1976) Abnormal hemoglobins in a quarter million people. Blood 48: 629-637.
- Weatherall DJ, Clegg JB (2001) Inherited haemoglobin disorders: an increasing global health problem. Bulletin of the World Health Organization 79: 704-712.
- Fucharoen S, Winichagoon P (1987) Hemoglobinopathies in Southeast Asia. Hemoglobin 11: 65-88. [crossref]
- Na-Nakorn S, Wasi P (1972) The distribution of hemoglobin E : hemoglobin E triangle in Southeast Asia. Journal of the Medical Association of Thailand 61: 65-68.
- Sattarattanamai C, Thongsuk S, Sutjaritchep P, Thuengsang D, Chomchuen S, et al. (2000) Prevalence of thalassemia and hemoglobinopathies in pregnant women at Surin Hospital. Med J Srisaket Surin Buriram Hosp 15: 1-12.
- Srisurin W (2011) Prevalence and effect of hemoglobin E disorders on Hba1c and lipid profile of diabetic patients at Surin Hospital. J Med Assoc Thai 94: 36-41.
- Fucharoen G, Sanchaisuriya K, Sae-ung N, Dangwibul S, Fucharoen S, et al. (2004) A simplified screening strategy for thalassaemia and haemoglobin E in rural communities in south-east Asia. Bull World Health Organ 82: 364-372.