Impacts of Municipal Solid Waste Management on Greenhouse Gas Emissions
Abdulshekur Ahmed 1*
1Department of Environmental Science, Addis Ababa university, College of Natural Sciences, School of Graduate Studies, Environmental Science Program, Addis Ababa, Ethiopia
*Corresponding Author:Abdulshekur Ahmed Husen, Department of Environmental Science, Addis Ababa University, College of Natural Sciences, School of Graduate Studies, Environmental Science Program, Addis Ababa, Ethiopia, Tel: +251914024267; Fax: +251914024267; E-mail:shukrikoo86@gmail.com
Citation: Abdulshekur Ahmed Husen (2022) Impacts of Municipal Solid Waste Management on Greenhouse Gas Emissions. SciEnvironm 5: 149.
Received: September 19, 2022; Accepted: October 03, 2022; Published: October 06, 2022.
Copyright: © 2022 Abdulshekur Ahmed, et al. This is an open-access article distributed under the terms of the Creative Commons Attribution License, which permits unrestricted use, distribution, and reproduction in any medium, provided the original author and source are credited.
Abstract
Climate change is the most important and dangerous, and certainly the most complex global environmental issue to date. Apart from direct threat to lives and the environment, climate change is a serious setback to sustainable development. Climate change is thought to be the culprit responsible for some of the recent environmental problems the world over, most prominent of which are severe flooding in parts of Asia and America, droughts in parts of Africa and the global food crises which gave rise to civil unrests in many parts of the world. Rising levels of greenhouse gases in the Earth's atmosphere are causing changes in our climate, and some of these changes can be traced to solid waste. The manufacture, distribution, and use of products-as well as management of the resulting waste-all result in greenhouse gas emissions. Waste prevention and recycling are real ways to help mitigate climate change. Waste management technologies, such as energy generation via landfill gas recovery, landfill bioreactors, aerobic composters, anaerobic digesters, incineration with energy recovery, refuse-derived fuel, and co-combustion in cement kilns, have been developed in several countries to curb GHG emissions in this sector. Policies such as the restriction of uncontrolled waste dumping sites in several developing countries; phase reduction of waste entering landfills in the; incentives to generate energy via landfill gas recovery; and the requirement of landfill gas recovery at large landfill sites are also being introduced to achieve this goal. This review article briefly covers works done to solve the problems of Impacts of Municipal Solid Waste Management on Greenhouse Gas Emissions capacity and possible solution to this problem.
Keywords: Climate Change, Greenhouse Gas Emissions, Waste Management, Global Warming
Introduction
The Earth has gone through many natural cycles of warming and cooling during droughts, flooding and extreme weather patterns. Scientists have confirmed that the Earth’s atmosphere and oceans are warming gradually as a result of human activity [4]. This warming will exacerbate climate variability and ultimately, adversely impact food and water security around the planet. Central to global warming and climate change is the “greenhouse effect”. Carbon dioxide (CO2), Nitrogen Oxides (NOX), Sulphur dioxide (SO2), dioxins, fine particles and other greenhouse gases entering the Earth’s atmosphere by activities of everyday energy use and the way of management of the environment still contribute to the build-up of Green House Gases (GHG), which are directly released into the atmosphere [5].
According to [15] climate change is the most important and dangerous, and certainly the most complex global environmental issue to date. Apart from direct threat to lives and the environment, climate change is a serious setback to sustainable development. Climate change is thought to be the culprit responsible for some of the recent environmental problems the world over, most prominent of which are severe flooding in parts of Asia and America, droughts in parts of Africa and the global food crises which gave rise to civil unrests in many parts of the world. Even though the current global economic recession has been blamed on unscrupulous economic practices (Obama, 2009), proper scrutiny may reveal that climate change has a hand in it.
Rising levels of greenhouse gases in the Earth's atmosphere are causing changes in our climate, and some of these changes can be traced to solid waste. The manufacture, distribution, and use of products-as well as management of the resulting waste-all result in greenhouse gas emissions. Waste prevention and recycling are real ways to help mitigate climate change [10].
Almost every waste management step generates greenhouse gas (GHG) emissions; hence, it is imperative to design appropriate treatment methods from sources to disposal sites for reducing their environmental impact [5]. Anthropogenic GHGs surely affect climate change; hence, GHGs have attracted research attention since the beginning of the 20th century [3]. The Intergovernmental Panel on Climate Change (IPCC) has stated that if action is not taken to prevent the continual increase of GHG emissions, the Earth's temperature will increase by 6.4°C during the 21st century [4].
Climate change is an urgent ecological and hydrological worry which disturbs the natural balance of environment, and it became the issue of much research and debate in recent decades. Climate change causes changes in temperatures, cloud cover, rainfall distribution, wind speeds, and storms: those all would disturb upcoming waste management processes [5].
Solid waste is any solid material which is discarded after use by its owner, user, or producer. Solid wastes are left-over arising from human, animal and plant activities that are normally discarded as useless and not having any consumer value to the person abandoning them [6].
Solid waste can play its role in climate change which could release GHGs and climate change can also have its effect on solid waste management. Total greenhouse gas baseline emission from domestic solid waste is estimated as 153.41 ton per day carbon dioxide equivalent, while compostable and recyclable accounted 80.02% and 11.73% respectively [9]. Globally, most municipal solid waste (MSW) is dumped in uncontrolled landfills where landfill gas (LFG) is generated as a by-product. LFG is produced when organic material decomposes anaerobically, consisting of 45% to 60% CH4, 40% to 60% CO2, and 2% to 9% other gases which are mostly released to the atmosphere [14].
The decomposition of organic wastes release CO2 and CH4 which are main GHGs gas, but inorganic waste does not contribute directly to greenhouse gas emissions unless it is incinerated. CH4 is created where there is anaerobic reaction while CO2 is the natural product when an aerobic reaction takes palace [15]. Both CO2 and CH4 are greenhouse gases, which contribute to global warming and climate change; however, the relative share of solid waste to climate change is low.
According to [31], the contribution of CH4 emission from landfills and dumps for greenhouse gas is only 1.7% of the total emissions from the Pacific island’s region. Climate change has accelerated the need to find a solution to reduce and manage the wastes we are creating. Climate change affects all solid waste management of activities like collection, separation, treatment, transfer, and disposal with varying levels of sophistication [11].
Waste management can be described as managing the waste generated via storage, collection, transfer/transport, recycling, dumping, and landfill while simultaneously considering the costs and effects on human health and the environment [6]. Each waste management step generates GHGs. Waste management technologies, such as energy generation via landfill gas recovery, landfill bioreactors, aerobic composters, anaerobic digesters, incineration with energy recovery, refuse-derived fuel, and co-combustion in cement kilns, have been developed in several countries to curb GHG emissions in this sector [5].
Policies such as the restriction of uncontrolled waste dumping sites in several developing countries; phase reduction of waste entering landfills in the European Union; incentives to generate energy via landfill gas recovery in the United Kingdom; and the requirement of landfill gas recovery at large landfill sites in the United States are also being introduced to achieve this goal [7].
In Indonesia, 60–70% of the generated waste is transported to landfills, while the remaining 30–40% ends up in rivers, burned, or independently managed by the community [8]. Such improper waste management can generate more GHGs than required.
Earth is under pressure of rapidly changing different extreme weather events such as droughts and flooding. It is universally recognized that the Earth’s lower portion and large water bodies are heating progressively because of man-made effects [1].
Many anthropogenic causes to climate change include burning of fossil fuel for energy generation, vehicular propulsion and industrial usage, deforestation, agricultural and waste sector [2]. Increased carbon-based energy and materials consumption in developed countries are among leading causes for the decline of all major life support systems on Earth. Power usage donates straightly to climate change by releasing carbon containing compounds into the atmosphere in surplus of normally available concentrations [3].
A naturally available concentration of greenhouse gases (GHGs) such as: water vapor, carbon dioxide (CO2), methane (CH4), and nitrous oxide (N2O), covering 1 - 2% of the Earth’s air, which soak-up part of incoming solar radiation that might be emitted back into atmosphere and supports warm the earth to an optimum and comfortable heat level. In the absence of normal "greenhouse effect," the current mean temperature 14 degrees Celsius on Earth could be approximately -19 degrees Celsius [10].
This review article briefly covers works done to solve the problems of Impacts of Municipal Solid Waste Management on Greenhouse Gas Emissions capacity and possible solution to this problem.
Different Municipal Solid Waste Management and Its GHG Emission Capacity
GHG emissions from waste transportation
In all scenarios, at the beginning, waste was transported from its source to temporary waste treatment facilities, processed by different treatment methods, and finally disposed of at the Landfill Site, as well as the ash from the incinerator facility. For open burning, the waste was assumed to be burned at source; hence, gaseous emissions are not produced by transport.
The estimation of emissions from transport operations was worked out by computing emissions from local waste collection and its further transportation. Together they represent emissions arising from all waste transport operations. For the collection part of waste, two different collection fleets were compared. The fleets examined were RBK’s actual source segregation fleet, and one that would suit the proposed partial co-mingled option. Owing to non-availability of information on transport fleet that would suit a full co-mingled option, it was not possible to determine transport emissions arising from this option [13].
According to studies by [13], The total transportation emissions for both source segregation and partial co-mingled/Mixed waste management options are resulted in 14, 234 t CO2e emitted for the source segregation and 13,323 t CO2e for the partial co-mingling collection fleet. The distance travelled in the collection operations was 543,942.2 km y−1 for the current source segregation fleet; the partial co-mingling scenario was modeled assuming the same distance travelled. The actual waste collection distance in the partial co-mingling scenario, however, may be different compared with the currently operative system of waste collection, i.e. Source segregation. The source segregation fleet consists of 34 vehicles, while the partial co-mingling fleet consists of 25 vehicles. This resulted in fewer carbon emissions for the partial co-mingling scenario. The source segregation fleet emits 0.227 t CO2e t−1 of waste and the partial co-mingling fleet emits 0.212 t CO2e t−1 waste. Nonetheless, a key point is that the collection part of waste transport is responsible for majority of the emissions [13].
GHG emissions from intermediate facilities
The operations at intermediate facilities include sorting at the MRF, placing similar materials together at the bulking stations and transfer of solid waste from collection vehicles into larger ones for further destinations. This amounted to 506 t of CO2e emitted for source segregation, 531 t CO2e for partial co-mingling, and 566 t CO2e for full co-mingling waste collection methods according Studies by [5]. The CO2e emissions from full and partial co-mingling are higher than source segregation. Full co-mingling represents the highest intermediate facilities emissions. A possible reason for this is that waste is placed in one container and collected in a single compartment of a vehicle; this requires more energy to later separate the different materials at the sorting stations [12]. Similarly, partial co-mingling waste is collected in two compartments of a vehicle, thus requiring greater energy at waste sorting stations than multiple smaller containers as in the source segregation method of waste collection.
GHG emissions from treatments
The various treatments considered include land-filling, incineration, and organic treatments (AD and IVC combined), For this, CO2e emissions and savings of the disposal treatments were considered; the emissions arise from land-filling and incineration treatments, while savings are made by organic waste (food and garden waste) treatments. According to Studies Waste land-filling resulted in the emission of 1966 t CO2e for source segregation, 1869 t CO2e for full co-mingling, and 1967 t CO2e for partial co-mingling [13]. Waste incineration (without energy recovery) resulted in 2409 t CO2e emitted for source segregation, 2429 t CO2e for full co-mingling, and 2538 t CO2e for partial co-mingling. It is rather questionable as to why the same amount of waste, when incinerated or land-filled, should have different emissions, albeit slightly, for the three waste collection options (source segregation, partial co-mingling, and full co-mingling [5].
This is a limitation in the GHG calculator, that it considers certain default waste percentages (of the total waste composition) for different treatments under full co-mingling and partial co-mingling waste collection methods and does not allow inputting the actual percentages of waste recycling, land filling, or incineration, for example. This may be possibly reflective of the inherent differences in the amount of waste that would be collected for land-filling, incineration, or recycling under these waste collection methods (source segregation, partial co-mingling, and full co-mingling). For example, the textile percentage for the partial co-mingled option is set at 2%, while that for full co-mingled is set at 0% (although the total textile tones entered by the user is the same). In practice, the composition of waste under source segregation, partial co-mingling, and full co-mingling can be significantly different compared with these default values. Clearly this is a weakness in the GHG calculator. Nonetheless, organic treatment resulted in savings of −871 t CO2e. In this case, the organic treatment results were the same for the three collection types, because food and garden waste are collected separately, and hence choice of MSW collection (source segregation, partial comingling, or full co-mingling) would have no bearing on carbon emissions/savings [5].
GHG Emissions caused by open burning
Open burning practices in agriculture, wildfires, and burning of waste are all sources of black carbon to the atmosphere. Globally, open burning of fields and forests accounts for approximately 40% of black carbon emissions [1]. Emission estimates are however uncertain and regional variations are considerable. Emissions are generally lower in the EU and Southern countries that have adopted no-burn methods in agriculture, while large emission remain in sub-Saharan Africa, Asia and the former Soviet states. In the Arctic countries, burning in the agricultural sector, including wildfires that spread from set agriculture and forestry fires, is the largest source of black carbon reaching the Arctic [5].
From the overall GHG emissions, the open-burning contribution is over 20%, with CH4 as the largest emitter, around 513 Gg, or 10 Gg CO2 -eq per year. CO 2 emissions, which result from oxidation, were the second most significant, with a rate of about 3 Gg per year [14]. Although lower, the amount of the open-burning share is comparable to previous similar estimates. The [12] estimated that for each tone of uncollected waste in the Philippines, around 36% is emitted, mainly due to CO2 emissions from open-burning and CH4 from open dumping.
Open burning is defined as burning materials without controlling the temperature or burning time, and smoke and air pollutants are released into the environment without passing through any air pollution control devices. Open burning is a significant local source of GHG emissions in developing countries; however, due to the manner in which it is carried out, no accurate statistics are available. GHGs such as CO2, CH4, and N2O are emitted through open burning. The amount of CO2 emitted by open burning depends on the waste composition and the oxidation factor, which is only 58%. As a considerable amount of carbon in the waste is not oxidized, CH4 is more relevant in open burning [11].
Emissions caused by incineration
The incineration of municipal waste involves the generation of climate-relevant emissions. These are mainly emissions of CO2 (carbon dioxide) as well as N2O (nitrous oxide), NOx (oxides of nitrogen) NH3 (ammonia) and organic C, measured as total carbon. CH4 (methane) is not generated in waste incineration during normal operation. It only arises in particular, exceptional, cases and to a small extent (from waste remaining in the waste bunker), so that in quantitative terms CH4 is not to be regarded as climate-relevant. CO2 constitutes the chief climate-relevant emission of waste incineration and is considerably higher, by not less than 102, than the other emissions [14].
The incineration of 1 Mg of municipal waste in MSW incinerators is associated with the production/release of about 0.7 to 1.2 Mg of carbon dioxide (CO2 output). The proportion of carbon of biogenic origin is usually in the range of 33 to 50 percent. The climate-relevant CO2 emissions from waste incineration are determined by the proportion of waste whose carbon compounds are assumed to be of fossil origin. The allocation to fossil or biogenic carbon has a crucial influence on the calculated amounts of climate-relevant CO2 emissions [13].
Emissions caused by incineration were calculated by considering the electricity generated and the related reduction in emissions. So, for the power plant in that uses coal, and EFs for electricity generation from coal are 0.32232 kg CO2/kWh for CO2, 0.00006 kg CO2-eq/kWh for
CH4, and 0.00280 kg CO2-eq/kWh for N2O [5]. As the electricity generated from waste can reduce coal usage, the reduction in emissions was assumed to be equal to the emissions produced by the electricity generation from coal [5].
Emissions caused by Waste Treatment Units (WTUs)
WTUs apply similar processes to Material Recovery Facilities (MRFs). In most part of the world Instead, of using well-known MRF technologies such as those utilized in developed countries, manual labor for separating, sorting, and storing materials is applied in WTU. Typically, recovered materials are sold to second-hand goods vendors [12]. Several studies conducted in developed countries have reported WTU EFs ranging from 0.047 to 4.448 [14,19]. In addition, the emission reduction and energy savings achieved by using recycled, rather than virgin, materials are not included.
Emissions caused by anaerobic digestion
A main objective of biogas industry is the reduction of fossil fuel consumption, with the final goal of mitigating global warming. However, anaerobic digestion is associated to the production of several greenhouse gases, namely carbon dioxide, methane and nitrous oxide. As a consequence, dedicated measures should be taken in order to reduce these emissions. According to [19] the main measures to improve the global warming reduction potential of biogas plants are: to use a flare avoiding methane discharge, to cover tanks, to enhance the efficiency of combined heat and power (CHP) units, to improve the electric power utilization strategy, to exploit as much thermal energy as possible, to avoid leakages. Similar conclusions were obtained by [20] for the specific case study of cereal crops in Umbria, Italy. Biomethane chain exceeds the minimum value of GHG saving (35%) mainly due to the open storage of digestate; usual practices to improve GHG reduction (up to 68.9%) include using heat and electricity produced by the biogas CHP plant, and covering digestate storage tanks [5].
According to this study, biogas use gives rise to a negative CO2 balance because CO2 caption results every time higher, in absolute values, than positive emissions from feedstock supply and biogas plant operation. As expected, biogas production from byproducts (e.g., from food residues, pomace, slaughter waste, cattle manure, etc.) is a more sustainable approach than energy crops utilization such as whole-wheat plant silage. Besides, digestate management provides significant contributions to total emission reduction in the case of specific feedstock such as municipal solid waste [5].
Harmful compounds and air contaminants are introduced into the environment during biogas production and use through both combustion processes and diffusive emissions. Considering carbon dioxide, combustion of biogas leads to efficient methane oxidation and conversion to CO2, with a rate of 83.6 kg per GJ (based on a biogas with 65% CH4 and 35% CO2 [25]). Other releases of this contaminant are related to transport and storage of biomass, as well as digestate use. In the case of both biogas combustion and biomass/digestate emission, CO2 is considered as biogenic and calculated neutral with regards to the impact on climate.
Methane released by biogas processes is not considered relevant for health issues: though exposure to hydrocarbon mixtures can have some adverse effects on humans,[27] no evidence exists of relevant interactions between methane and biologic systems.[28] However, methane is a greenhouse gas whose global warming power is estimated to be 28–36 times higher than CO2 over 100 years: as such, it is the second major component among anthropogenic greenhouse chemicals [29]. Hence, in evaluating the impact of biogas industry on climate change, methane emissions are a point of primary importance. Methane can be released during biogas incomplete combustion; however, a strong contribution to this contaminant comes out from diffusive emission related to biomass storage and digestate management. On the other hand, other biomass management strategies must be taken into account to abate emissions related to biogenic methane. methane emissions were also discussed; in all investigated cases, the emission rates were below 5 g kg¡1. Considering cattle manure, important reductions in methane emission are related to digestate processing and handling, since this kind of biomass is characterized by high methane emission rate when spread in the field without any pre-treatment.
Besides CO2 and CH4, nitrous oxide (N2O) is another important GHG: Due to its high greenhouse effect potential, N2O emissions from biogas production processes can result into a significant contribution to global warming budget. [30,31] The relative impact of nitrous oxide mostly depends on the chosen climate metrics: indeed, N2O impact can even exceed those of CO2 and CH4, when the considered metric is Global Temperature change Potential with a time horizon of 100 years (namely GTP-100).[32].
Total GHG emission for energy production from biogas are generally calculated in a range between 0.10 and 0.40 kg CO2-eq/kWhel, which is for instance 22–75% less than GHG emissions caused by the present energy mix in Germany [13]. The wide uncertainty about the estimates of global warming mitigation potential depends on N2O emission rate assessment as well as on storage and use as a fertilizer of digestate, as discussed in paragraphs below.
Along GHG reduction benefits, it must be considered that biogas combustion is associated to release of pollutants in the atmosphere; therefore, the correct assessment of these emissions is a key point in social acceptance of this technology.
Carbon monoxide (CO) is produced in all oxidation processes of carbon containing materials, and is an important byproduct of incomplete combustion of biogas. Methane emission rates are 0.74 and 8.46 and g CO per Nm¡3 CH4 for flaring and CHP, respectively [14]. CO emissions related to energy production are estimated in a range between 80 and 265 mg CO MJ¡1, depending on the plant efficiency [13].
Sulphur dioxide (SO2) emissions from biogas plants manly depend on the desulphurization degree of the introduced biogas. The SO2 emission rate of a CHP biogas plant is estimated to lie in the range 19.2–25 mg MJ¡1.[25] The UK National Society for Clean Air (NSCA) estimates an emission factor of 80 and 100 gSO2/ton waste for flaring and CHP, respectively [16]. The relatively high SO2 concentrations in the proximity of biogas plants can depend on different reasons, e.g.: direct emission from biogas combustion, H2S oxidation from diffusive emissions, And diesel truck exhausts.
Emissions of NOx are one of the most critical points with regard to environmental impact of biogas plants [22] According to,[21] the NOx emission level of biogas is, in general, higher than for natural gas engines: the averaged aggregated emission factor is 540 g NOx GJ¡1, which is more than three times the rate from natural gas engines. When emission factor is reported to methane consumption, an emission factor of 0.63 and 11.6 g NOx/Nm3 CH4 can be assumed for flaring and CHP, respectively. The importance of controlling this pollutant is demonstrated by several case studies. For instance, [22] in the above-mentioned case study of an intensive dairy farm situated in the Po valley (Italy) reported a low enhancement in acidification (5.5–6.1%), particulate matter emissions (0.7–1.4%) and eutrophication (C0.8%), while on the other hand a significant enhancement in photochemical ozone formation potential (41.6–42.3%) was calculated. In another case study, [ 19] estimated a potential enhancement of up to 10% of NOx emission in 2020 in California (US).[13]
Noticeably, fuel-cycle emissions can be strongly influenced by the raw materials. For instance, CO2, CO, NOx, hydrocarbons and particles may differ by a factor of 3–4 between ley crops, straw, sugar beet byproducts, liquid manure, food industry waste and municipal solid waste. On the other hand, differences by a factor of up to 11 can be observed in SO2 emissions, due to the high variability of H2S and organic Sulphur compounds in the produced biogas [23].
As for incineration, calculations for anaerobic digestion also take account for the reduction in emissions due to electricity generation. Here, 100 kWh of electricity is assumed to be generated by the anaerobic digestion per ton of waste [22], reducing emissions by the amount produced by the electricity generation from coal. The energy required to run anaerobic digesters is not considered.
Although anaerobic digestion is anaerobic, sometimes, some aerobic conditions occur; hence, CO2 emissions are still produced, such as during start-up, shutdown, material transfer, and storage, as well as by malfunctions [6,23]. Here, CO2 emissions are not considered as they are of biogenic origin or are derived from the natural carbon cycle [15]. The produced biosolids or sludge are sent to landfills and are assumed to be equivalent to 50% of the initial waste received [6].
Emissions caused by composting
Composting essentially treats waste aerobically and affords CH4 emissions due to anaerobic processes. Other gases such as N2O, NH3, CO, and CO2 are also emitted. As the CO2 produced by composting is of biogenic origin and not derived from fuel, it is not considered to be a GHG; thus, it is not considered herein [15,16]. The composting facility that is mostly managed by untrained workers; therefore, poor composting management affords higher emissions, especially of CH4 and N2O [5].
Making compost requires energy. Machines are necessary to grind and mix feedstocks as well as to set up compost piles. These piles will generally require turning, forced aeration or some type of agitation to ensure that aerobic conditions are maintained. Aerobic composting will produce a stable compost rapidly with the least number of objectionable odors. All energy used for compost production will have an associated equivalent GHG cost. Liters of diesel fuel and kilowatts of electricity used each have an associated GHG debit. For example, combustion of one liter of fuel produces 2.75 kg of CO2 [13]. This is minor in comparison to the methane avoidance credits gained by diverting material from landfills [18].
Of greater concern than energy requirements is the potential for fugitive GHGs to be emitted directly from the compost piles as they are decomposing. Both CH4 and N2O emissions from composting feedstock have been observed. Methane is formed under severely anaerobic conditions. The formation of N2O, which has 296 times the global warming potential of CO2, is not as well understood. Nitrous oxide can be formed during both nitrification and denitrification reactions although it is more commonly produced during denitrification Nitrification is the reaction that turns organic nitrogen into ammonia and nitrate. Denitrification is the reaction that returns nitrate to its gas form. Both reactions will occur during composting. While CH4 is normally detected at the bottom of a compost pile where oxygen is absent, N2O will evolve closer to the surface of the pile, where some oxygen may still be present [1]. It will also tend to form in cases where N is not limiting. Where N is in short supply, the microbes that are actively decomposing organics in the pile will scavenge available N for their own uses and release of nitrogen gas will be minimal [24].
From the range of studies published on this topic, some general trends are clear. More CH4 is formed when the compost feedstocks are wet. More N2O is formed when feedstocks are wet and also when less carbonaceous material is present. For example, composting manure with high moisture and low straw will produce more GHGs than composting manure with more straw in a drier pile [11]. As methane is formed where conditions are anaerobic, it will be more abundant at the bottom of a pile. Turning the pile will release the methane. However, turning also will ensure better aeration and therefore reduce methane production overall. A study with static piles without forced aeration showed very high methane release [17] A cover of finished compost will also limit methane release as microbes in the finished compost will oxidize the methane before it is released into the atmosphere. These results suggest that careful management of composting operations can significantly reduce or eliminate GHG emissions from compost piles [5, 23].
Emissions caused by controlled landfill sites
Landfill is the main contributor to CH4 emissions in the waste sector. Poorly managed landfill sites in which gas extraction systems are not utilized or where waste is simply dumped into an excavated hole are ubiquitous in developing countries [6,12,24]. In this study, the landfill EF is applied as a controlled landfill with commingled waste [20]. The emitted CO2 is considered to be of biogenic origin; thus, it is not a GHG.
In addition to regular waste, landfill also receives incineration ash, biosolids from anaerobic digesters, and unrecovered materials from WTUs. However, only the unrecovered materials are considered during the calculation of the total landfill GHG emissions as CH4 gas is produced in landfill sites by the activity of microorganisms [6], while ash is not considered to be biodegradable, and the CH4 produced by biosolids is weaned off by anaerobic digestion. In this study, the electricity needed to run office buildings at landfill sites or fuel needed for heavy equipment, such as bulldozers and excavators, is not considered as it is negligible compared to the released CH4 [20].
The results are consistent with similar studies comparing the GHG emissions from different landfill structures. [32] reported a 37% emission difference between anaerobic landfilling and semi-aerobic landfilling of city market solid waste within one year [27]. Similarly, in a life cycle assessment comparison of landfilling technologies for 100 years, it was estimated that about 14% less CH4 was generated between open dumping and semi-aerobic landfilling [20]. In another study, in comparing the GHG and global warming contributions of 1 ton of waste to several landfill structures, open dumping emissions resulted in 10 0 0 kg CO2 -eq per ton while the emissions for a sanitary landfill were 300 kg CO2 -eq per ton [21].
Approximately 5% of anthropogenic greenhouse gas (GHG) emissions are derived from solid waste disposal worldwide (Solomon et al.2013). In China, almost 1.5% (111.81 Tg CO2-eq yr−1) of the total anthropogenic GHG originated from waste treatment in [3]. Landfill is a common land use type, and the GHG emissions from which have received much public attention [18] For instance, previous study reported that emission fluxes ranged from 0.9 to 433 mg CH4 m−2 h−1, 2.7 to 1200 μg N2O m −2 h−1, and 12.3 to 964.4 mg CO2 m−2 h−1 from a sanitary landfill at Perungudi in Chennai, a mega-city in India [33]. In comparison, scholars have given less concern to GHG emis- sions from limited-controlled landfills. It has been found that average CH4, CO2, and N2O in emission ranged from < 0.04 to 1800, 4.9 to 1800, and < 0.0001 to 0.35 mL m−2 min−1, respectively, from a dumping landfill site with waste ages of approximately 0.5 year. Moreover, studies on the factors affecting their release and control techniques also received wide concern [33].
Five leachate treatment plants in South China, landfill leachate treatment could be a significant potential source of N2O emission, with the N2O flux and dissolved N2O of 58.8 ng mL−1 h−1 and 1309 ng mL−1, respectively (Lin et al., 2008). In addition, the cumulative GHG emissions from fresh leachate storage ponds, fresh leachate treatment systems, and aged leachate treatment systems were measured as 19.10 10.62, and 3.63 Gg CO2-eq yr−1, respectively [17]. Due to the shortage of treatment facilities, dissolved GHGs in the leachate discharged from limited-controlled landfills may be higher than that from sanitary landfills. Therefore, this is a non-negligible potential source of GHGs [33].
What is Climate Change?
Climate change is the subject of how weather patterns change over decades or longer. Climate change takes place due to natural and human influences. Since the Industrial Revolution (i.e., 1750), humans have contributed to climate change through the emissions of GHGs and aerosols, and through changes in land use, resulting in a rise in global temperatures.1 Increases in global temperatures may have different impacts, such as an increase in storms, floods, droughts, and sea levels, and the decline of ice sheets, sea ice, and glaciers [23].
Process of Global Warming
The earth receives energy through radiation from the sun. GHGs play an important role of trapping heat, maintaining the earth’s temperature at a level that can sustain life. This phenomenon is called the greenhouse effect and is natural and necessary to support life on earth. Without the greenhouse effect, the earth would be approximately 33°C cooler than it is today.2 In recent centuries, humans have contributed to an increase in atmospheric GHGs as a result of increased fossil fuel burning and deforestation. The rise in GHGs is the primary cause of global warming over the last century [23].
There are three main datasets that are referenced to measure global surface temperatures since 1850.3 These datasets show warming of between +0.8°C and +1.0°C since 1900.4 Since 1950, land-only measurements indicate warming trends of between +1.1°C and +1.3°C, as land temperatures tend to respond more quickly than oceans to the earth’s changing climate. Figure .1 shows the global surface temperature trend (1880–2014) [18]. Figure 1
Figure 1: Instrumental temperature data 1880–2014. Source: NASA Goddard Institute for Space Studies (GISS) taken from [5].
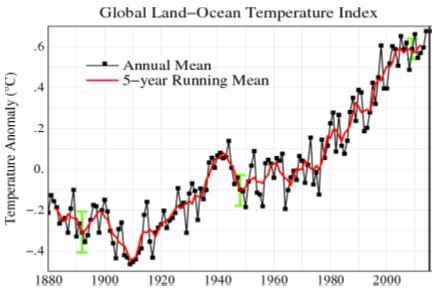
While global warming is typically measured on multi-decadal time scales (30+ years), attributing trends over time periods of less than 30 years can be tricky, due to the influence of natural variability. Natural variability is defined as variations in climate that are due to internal interactions between the atmosphere, ocean, land surface and sea ice. Those variations occur with or without climate change and are often described as “noise” or normal variations around a “normal” value. The El Niño Southern Oscillation (ENSO) cycle is considered to be the strongest source of internal natural variability due to the exchange of heat between the oceans and the surface along the equatorial Pacific. Because of this internal and natural variability, global warming does not necessarily occur linearly in response to the increase in GHG concentrations, and various periods of accelerated warming and warming slowdowns are a natural source of variability. Figure 2.2 shows two such periods in the context of longer-term global warming and also illustrates natural variability occurring on a yearly basis [26].
What is Causing Global Warming?
The climate of the earth is affected by a number of factors. These factors include output of energy from the sun (warming effect), volcanic eruptions (cooling effect), concentration of GHGs in the atmosphere (warming effect), and aerosols (cooling effect) [23].
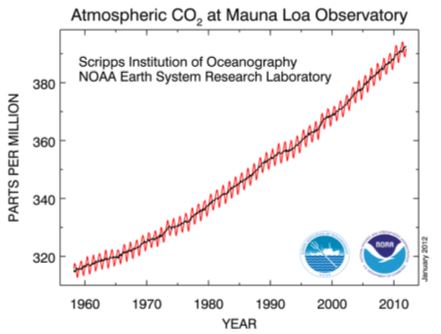
Since the Industrial Revolution (i.e., 1750), the largest contributor to the increase in global warming is carbon dioxide (CO2), followed by methane (CH4). CO2 concentrations have increased from 278 parts per million (ppm) in 1960 to 401 ppm in 2015—a 44% increase [23].
Since 1951, approximately 100% of warming is attributed to anthropogenic forcing, while more than 100% is due to greenhouse gases due to offsets in anthropogenic aerosols. Natural forcing and internal variability are considered to be negligible during this time period.
Primary Causes of Climate Change
A review of the factors purported to be responsible for climate change will reveal that climate change is inevitable. The primary cause of climate change is the variation of the solar radiation retained by the earth’s surface [18]. Routinely, variation in the quantity of solar radiation reaching the earth is controlled by three cycles known as the Milankovitch cycles. They are the eccentricity which has a 100,000 years cycle and has to do with the shape (elliptical or circular) of the earth at any time; precision of the equinoxes which has a cycle of 26,000 years and has to do with earth’s rotation; and obliquity which has a 41,000 years cycle and has to do with the inclination or tilt of the earth [23]. Other occasional factors which may lead to short-lived climatic variations include: volcanic eruptions, variation in solar outputs, variation in orbital characteristics and variation in atmospheric CO2 [13].
Research efforts have shown that deforestation and burning fossil fuel have increased atmospheric CO2 from 280ppm to 380ppm between early 1700’s and 2005. This represents 35.7 % increase in about 300 years and all things being equal, 100% increase in the next 530 years. The greenhouse gases that are making the largest contribution to global warming besides carbon dioxide (CO2) are methane (CH4) and nitrous oxide (N2O) both of which are produced during the management and disposal of wastes [21].
The figure (using the data obtained from [7] shows that by 2030, the concentration of greenhouse gases in the atmosphere will be equivalent to 1500 mega tones of CO2. This implies that, if the current trend is not checked, a time will come when climate change will no longer be a recurring phenomenon that takes hundreds of thousands of years but a sustained event. Countries have to reduce their dependence on fossil fuel in order to check the rate of climate change, but there is no readily available replacement for fossil fuel [23].
Water vapour has an important indirect effect on temperature increases resulting from increasing GHG concentrations. Increased global temperature resulting from GHGs increases the capacity of the atmosphere to hold water vapour, thus acting as positive feedback, as water vapour also produces a greenhouse effect. An increase in global temperature by 1°C results in approximately a 7% increase in atmospheric water vapour. “Therefore, although CO2 is the main anthropogenic control knob on climate, water vapour is a strong and fast feedback that amplifies any initial forcing by a typical factor of between two and three. Water vapour is not a significant initial forcing, but is nevertheless a fundamental agent of climate change” [4]. Figure 2
Figure 2: Growth of CO2 concentrations at Mauna Loa Observatory since 1960 taken from [7]
GHGs (particularly CO2) have a longer residence time in the atmosphere (~100 years) compared to aerosols (only 10 days). As a result, the short-term effect of industrial pollution can be cooling followed by long-term warming. Aerosols are expected to offset a lower percentage of greenhouse warming in most future scenarios due to residence time, which allows for the possibility of an acceleration of future warming even without an acceleration of GHG concentrations [11].
The greenhouse effect occurs when solar energy making contact with the earth’s surface is retransmitted to the atmosphere in the form of infrared thermal radiation. This radiation has a lower wave frequency than solar energy itself. GHG molecules absorb this thermal radiation at low frequencies, causing these molecules to vibrate. These greenhouse molecules then emit energy in the form of infrared photons, many of which return to the earth’s surface. Non-GHGs such as oxygen and nitrogen do not absorb thermal radiation [11].
The greenhouse effect occurs when solar energy making contact with the earth’s surface is retransmitted to the atmosphere in the form of infrared thermal radiation. This radiation has a lower wave frequency than solar energy itself. GHG molecules absorb this thermal radiation at low frequencies, causing these molecules to vibrate. These greenhouse molecules then emit energy in the form of infrared photons, many of which return to the earth’s surface. Non-GHGs such as oxygen and nitrogen do not absorb thermal radiation [21].
The greenhouse effect is measured in terms of Radiative Forcing (RF) in units of watts per square meter (W/m2). Since the Industrial Revolution, the total RF is estimated to have increased by approximately 2.3 W/m2 (1.1 W/m2 – 3.3 W/m2; 90% confidence interval) mainly due to the net effect of increased GHG and aerosol concentrations in the atmosphere [29].
The response of climate to the change in the earth’s energy is referred to as climate sensitivity. Equilibrium Climate Sensitivity (ECS) is used to gauge the long-term response (i.e., 100+ years) to a doubling of CO2 concentrations in the atmosphere, and estimates range from 1.5°C to 4.5°C according to the IPCC. This corresponds with an increase in RF of +3.7 W/m2 (+3.0W/m2 to +4.4 W/m2). Alternatively, a Transient Climate Response (TCR) estimate is used to gauge shorter-term impacts (i.e., over 20 years) to a doubling of CO2 concentrations in the atmosphere, and estimates range from 1.0°C to 2.5°C. The shorter-term estimates are lower due to the time it takes to heat up the oceans [14].
Historical Emissions
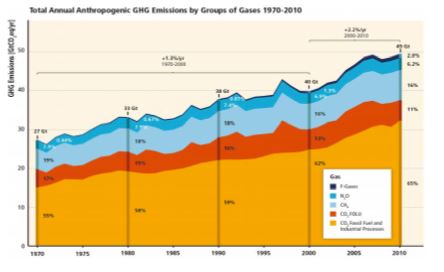
Figure 2.5 shows historical anthropogenic GHG emissions by type of GHG (expressed as CO2 equivalent/year). CO2 emissions represented 76% of GHG emissions. “CO2 FOLU” refers to net CO2 emissions resulting for forestry and other land use [15]. Figure 3
Figure 3: Historical Annual Anthropogenic GHG emissions, 1970–2010 (Gt CO2e/yr)15 taken from [18]
Future Emissions Pathways
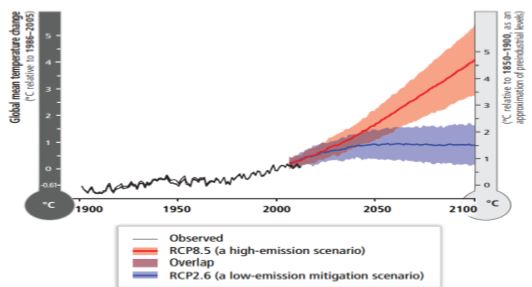
There are many factors that can influence future GHG emissions. The 2013 IPCC report uses Representative Concentration Pathways (RCPs) to illustrate various plausible emission scenarios, ranging from an aggressive action plan to mitigate greenhouse warming (RCP 2.6) to a fossil fuel-intensive scenario (RCP 8.5), where annual carbon emissions continue to increase. Climate model projections using RCP 2.6 to RCP 8.5 range from a century scale (between 1995 and 2090) increase of between +1.0°C [0.3°C, +1.7°C] and +3.7°C [2.6°C, 4.8°C] (mean estimates of low- and high-carbon scenarios with 90% confidence intervals). Note these estimates exclude warming prior to 1995 (~+0.6°C). The IPCC does not offer an opinion as to the likelihood of these scenarios essentially because it is not a “science” question but rather a “societal” question – how much reduction do the societies are willing to reach during the next century [16].
Environmental and Social Impacts of Climate Change
Climate change involves a variety of potential environmental, social, and economic impacts. In most situations, these impacts will be adverse; in a few isolated situations, these could be more favorable (such as increased crop yield). The severity of the adverse impacts will increase with the rise in the average global temperature. Even if global warming is kept within 2°C relative to pre-industrial levels, adverse impacts will be experienced and the world will need to take appropriate measures to adapt to new climate conditions. If, in spite of the world efforts, the temperature increase goes beyond the 2°C threshold, it has been assessed that the consequences would become increasingly severe, widespread and irreversible [4].
Canada has already become warmer by 1.5°C on average from 1950 to 2010.18 Climate change is expected to make extreme weather events, such as heat waves, acute rainfall, floods, storms, droughts, and forest fires, more frequent and/or more severe in Canada. Worldwide, the areas in which adverse impacts will be experienced are described below [17].
Floods and Droughts
Floods are expected to occur more frequently on more than half of the earth’s surface. In some regions, they could decrease. During winter, snowfalls are expected to decrease in mid-latitudes, resulting in less significant snowmelt floods during the spring season. In Canada, increased rainfall is forecasted for the entire country [19].
On the other hand, meteorological droughts (less rainfall) and agricultural droughts (drier soil) are projected to become longer or more frequent in some regions and some seasons, especially under the RCP 8.5, because of reduced rainfall and increased evaporation, like in British Columbia and the Prairies. More severe droughts will put additional pressure on water supply systems of dry areas, but could be manageable in wetter areas, assuming adaption measures are implemented [19].
Reduction in Water Resources
Renewable water supply is expected to decline in certain areas and expand in others. In regions where gains are expected, temporary deficits of water resources are still possible because of increased fluctuations of stream flow (caused by higher volatility of precipitation and increased evaporation during all seasons) and of seasonal cutbacks (because of lower accumulation of snow and ice). Clean water supply may also decrease due to a warmer environment inducing lower water quality. For example, algae-producing toxins could damage the quality of sources such as lakes. Such overall decline in renewable water supply will intensify competition for water among agriculture, ecosystems, settlements, industry, and energy production, affecting regional water, energy, and food security [13].
Rising Sea Levels
In some regions such as the U.S. Eastern Coast, tides are reaching up to three feet higher than they used to 50 years ago.20 Rising sea levels will have more and more negative consequences near the coasts—such as flooding, erosion of the coasts, and submergence of low-lying regions—putting at risk populations, infrastructure, animals, and vegetation near the coasts. Low-lying regions (like Bangladesh) and whole islands (like the Maldives and Kiribati) are at risk of destruction in the short term from rising ocean levels, floods, and more intense storm urges [13].
Around the world, 15 of the 20 biggest urban regions are located near the coast (14 in Asia) and around 200 million people reside fewer than 30 miles from the ocean. Based on a Reuter’s analysis, more than $1.4 trillion worth of real estate would be at risk on the coast of the U.S. alone. “An increasing percentage of the U.S. population and economic assets—including major U.S. cities and financial hubs such as Miami, Lower Manhattan, New Orleans, and Washington DC—are located on or near coasts, and they are threatened by sea-level rise.” [21].
Changes in Ecosystems
In the past millions of years, climate changes have naturally occurred at slower paces, permitting the ecosystems to adapt. However, in the 20th century many argue that we have entered the Anthropocene.23 Species extinction rate has exceeded by up to 100 times the “normal” pace (i.e., without anthropogenic impact). We are facing a major biodiversity crisis and we might even be entering a sixth “mass extinction”.24 In the 21st century and beyond, the risk of extinction that land and aquatic species are exposed to is higher under all RCP scenarios. As early as 2050, the rapid changes that are currently taking place are expected to jeopardize both land and ocean ecosystems, particularly under RCP 6.0 and RCP 8.5. It may be noted that the changes in ecosystems involve much more than climate change. Massive extinctions are caused by many factors including urbanization, increased world population, etc. Of course, climate change has made its contribution which will amplify with time [22]
Even under RCPs projecting modest global warming levels (RCP 2.6 to RCP 6.0), the majority of ecosystems will remain vulnerable to climate change. The increase in average temperatures will cause a lot of terrestrial and aquatic species to migrate towards more adequate climates, but many of them will not be able to do so quickly enough during the 21st century under RCP 4.5 to RCP 8.5, thus jeopardizing biodiversity. This migration trend is already being observed for vegetal and animal species in Canada [13].
Food Production and Security
Obvious climate change impacts on terrestrial food production can already be observed in some sectors around the globe. In the past few years, climate extremes such as droughts have occurred in major producing areas, resulting in many episodes of price hikes for food and cereals. Although these effects are beneficial in certain areas, adverse consequences are more frequent than favorable ones, especially, because key production areas (e.g. California) are located in historically favorable areas which will become unfavorable. Many climate change impacts will increasingly affect food security—particularly in low-latitude regions—and will be exacerbated by escalating food demand.26 Forecasted ocean-level rise will threaten crucial food-producing areas along the coasts, such as India and Bangladesh, which are major rice producers [28].
Climate change is also a key political issue, and its consequences, such as food insecurity, are already generating conflict in vulnerable regions around the globe. For example, in northern Africa, there is increasing evidence that even though climate change impacts such as food insecurity are not the “cause” of the 2011 Arab spring, they may have precipitated the uprisings. The expected impacts of climate change—such as extreme temperatures, flooding, droughts, rising ocean levels, and ocean acidification—will not only exacerbate existing tensions but will also be a major challenge for homeland security [27].
Climate Change and Environmental Health
Climate change has a lot of implications for the environment and consequently public health. While it has been estimated that for 1m rise in sea level, 3.7 million people will be displaced from the coastal regions of Nigeria [30], droughts in the hinterlands will lead to unhealthy sanitary conditions. Additional application of fertilizer may be needed to take advantage of the potential for enhanced crop growth that can result from increased atmospheric CO2. This can pose a risk, for additional use of chemicals may impact water quality with consequent health, ecological, and economic costs [30]. The two most important climatic elements determining the occurrence and localization of pests and diseases appear to be moisture and temperature. In general, pests and disease vectors do better when the temperature is high under conditions of optimum water supply. Global warming is therefore likely to extend the range of distribution of certain pests and diseases of crops [26]. In general climate change is associated with (i) variability and changes in rainfall patterns; (ii) changes in water levels in lakes, rivers, seas, ponds, streams and groundwater; (iii) frequency of storms and droughts; (iv) increased desert encroachment, and (v) excessive heat. Almost all of these have serious implications for the environment and public health [17].
If climate change keeps occurring as forecasted under RCP scenarios, it will influence human health in three different ways:
• Extreme weather events have direct impacts such as increased risks of death and disability.
• Alterations of the environment and ecosystems indirectly affect human health, such as a higher prevalence of waterborne illnesses caused by higher temperatures or increased death and disability rates during extreme heat episodes. Climate change will exacerbate current illness loads, especially in regions with fragile healthcare systems and lesser ability to adapt. Poor regions—especially poor children—are expected to be the most vulnerable to climate-related health risks.
• Other indirect consequences pertaining to societal systems will arise, such as under-nutrition and mental disorders caused by stressed food production systems, increased food insecurity and relocation resulting from climate extremes.
Economic Impacts of Climate Change
In all likelihood, environmental and social impacts of climate change discussed above will have financial consequences on many sectors across the economy. Based on the Stern Review on the Economics of Climate Change, the price of doing nothing about climate change will be equivalent to an annual loss of 5% or more in global GDP, ad infinitum. If a broader spectrum of effects and contingencies is included in the analysis, the estimated costs could reach 20% of GDP or more. In comparison, the price of managing to stabilize atmospheric GHG levels within a range of 500–550 ppm of CO2 equivalent is estimated to be 1% of global GDP annually, assuming that we begin implementing sharp mitigation measures now. Therefore, this cost/benefit analysis is a clear economic incentive to take significant actions sooner than later [30].
A fundamental transformation away from fossil fuels and towards renewable energy at a global level such as envisaged under RCP 2.6 will have very large local and global consequences for all economic sectors, and presents both opportunities and downside risks. For example, the growth in energy demand has historically been highly correlated to gross domestic product (GDP) growth per capita, especially in low- and middle-income economies.31 Moving away from fossil fuels involves a risk of “stranded assets”, but taking action to mitigate climate change will generate substantial commercial opportunities, with the development of new markets such as energy technologies and other goods and services that are low-carbon. “These markets could grow to be worth hundreds of billions of dollars each year, and employment in these sectors will expand accordingly. The world does not need to choose between averting climate change and promoting growth and development [31].
Thus, both physical impacts of climate change and adaptation measures will have consequences on basically all sectors across the economy. Here are some of them.
• The increased frequency and magnitude of extreme weather events will affect the insurance industry, causing greater damage and higher loss volatility to property/casualty, life, and health insurance. It may make it more difficult for insurance systems to provide coverage at a reasonable cost and to increase the risk-based capital.
• Impacts on human health will expand the need for healthcare and add stress to existing healthcare systems.
• The financial services industry may also be impacted at different levels, based on their asset/loan portfolios’ vulnerability to climate change.
• Weather-sensitive sectors such as agriculture, forestry, fisheries, tourism, hydroelectricity, transportation, and mining will inevitably be impacted.
• Economic development and productivity may decline.
• Extreme climate and weather events may threaten the proper functioning of pipelines, electricity grids, and transport infrastructure.
• The need for heating may lessen, and the need for cooling intensify, in properties of both individuals and businesses.
Estimations and projections of economic costs are complex and rely upon a multitude of assumptions that are difficult to determine. They vary widely among different countries. “Further research, collection, and access to more detailed economic data and the advancement of analytic methods and tools will be required to assess further the potential impacts of climate on key economic systems and sectors [9].
The climate change impacts discussed above will cause rising risk exposure as the average global temperatures rise. Figure 2.7 below illustrates the observed and predicted global warming trends based on two RCPs alongside the degree of additional risk associated with different levels of potential global warming [7]. Figure 4
Figure 4: A global perspective on climate-related risks taken from [13].
Global warming projections suggest that climate change impacts will vary greatly among regions, and happen on different time scales. However, it is important to keep in mind that a myriad of interrelations exist among communities worldwide. Effects of climate change occurring in a particular region may trigger ripple effects around the globe via internationally connected systems like the economy. For example, extreme climates interfering with agricultural harvests or warming sea temperatures leading to reduced fishing yields in a given region may affect both prices and food supply throughout the world. Moreover, climate change may modify migration patterns of human beings, other living organisms and physical materials, thus triggering collateral consequences elsewhere, even in remote areas. “Migration can affect many aspects of the regions people leave, as well as many aspects of their destination points, including income levels, land use, and the availability of natural resources, and the health and security of the affected populations—these effects can be positive or negative [24].
Also, as early as 2030, the population is projected to grow to 8 billion people. The U.S. National Intelligence Council’s “Global Trends 2030: Alternative Worlds” found that because of increases in the global population and the consumption patterns of an expanding global middle class, in less than two decades demand for food would increase by 35 percent, freshwater by 40 percent, and energy by 50 percent.36 There is growing evidence that water, food, and energy are closely interrelated. Therefore, sustainable solutions to address reduction in water resources, food security issues, or energy challenges should consider this relationship to avoid having unintended collateral consequences in other areas [20].
For these reasons, in order to serve the public interest and provide best advice to our clients, we need to keep global well-being in mind, rather than focusing on a region- or sector-specific outlook.
United Nations Framework Convention on Climate Change
In 1992, the text of the United Nations Framework Convention on Climate Change was adopted by 196 parties/countries. The convention states its ultimate objective, which is to stabilize the concentration of GHGs in the atmosphere “at a level that would prevent dangerous anthropogenic (i.e., human) interference with the climate system.” [18]
Parties meet annually at the Conference of the Parties (COP) to negotiate multilateral responses to climate change. In 1997, the Kyoto Protocol was adopted at COP3, being the world’s first GHG emissions reduction treaty based on the principle of ‘Common but Differentiated Responsibilities’. The Kyoto Protocol came into force in late 2004 and expired in 2012. Canada was the first party to withdraw from the protocol in 2007. In 2009 (COP15), the Copenhagen Accord40 represented the first time that the parties formally recognized that the increase in global temperature should be kept below 2°C [18]
Intergovernmental Panel on Climate Change
The IPCC is a scientific body which oversees the reviews and assesses the most recent scientific, technical, and socio-economic information produced worldwide relevant to the understanding of climate change. Thousands of scientists from all over the world contribute to the work of the IPCC on a voluntary basis as authors, contributors, and reviewers. The IPCC aims to reflect a range of views and expertise to provide rigorous and balanced scientific information to decision makers. The work of the organization is relevant, neutral, and non-prescriptive [18].
The IPCC is currently organized in three working groups and a task force that deal with different aspects of climate change:
• Working Group, I—the physical science basis of climate change;
• Working Group II—climate change impacts, adaptation, and vulnerability;
• Working Group III—mitigation of climate change; and
• Task Force—refine a methodology for the calculation and reporting of national GHG emissions and removals.
The IPCC provides different reports (assessment reports (AR), special reports, and methodology reports). The most recent assessment report (AR5) was finalized in November 2014 with the following highlights:
• Evidence that the climate is warming is unequivocal (Synthesis Report SPM41—page 1);
• The oceans have absorbed some of the CO2, causing acidification (WG1 SPM—page 11);
• Sea levels have risen and the rate of rise is accelerating (WG1 SPM—pages 11 and 26);
• The economic costs of mitigation would reduce consumption growth by about 0.04 to 0.14 percentage points per year (Synthesis Report SPM—page 24), depending on the level of warming; and
• Limiting total human-induced warming to less than 2°C with a probability of greater than 66% would require cumulative CO2 emissions to remain below 2,900 Gt CO2 (Synthesis Report SPM—page 10). (RCP 2.6).
Mitigation and Adaptation for Climate Change
The IPCC reports describe the consequences of uncontrolled global warming. “Continued emission of greenhouse gases will cause further warming and long-lasting changes in all components of the climate system, increasing the likelihood of severe, pervasive and irreversible impacts for people and ecosystems. Limiting climate change would require substantial and sustained reductions in greenhouse gas emissions which, together with adaptation, can limit climate change risks.” [15]
Technology development along with reduced energy use, decarbonized energy supply, reduced net emissions, and enhanced carbon sinks in land-based sectors are needed. This is discussed in greater detail below.
Adoption of Circular Economy
Adopting a new approach of “circular economy” can also mitigate resource scarcity. This refers to an industrial economy that is restorative by definition. It aims to rely on renewable energy; minimize, track, and hopefully eliminate the use of toxic chemicals; and eradicate waste through careful design [11].
Land use productivity will determine whether the world can feed a population projected to grow to 8 billion by 2030, while sustaining natural environments. This is twice the 4 billion the earth had to feed as recently as 1974. Food production can be increased and forest protected by raising crop and livestock productivity, using new technologies, and comprehensive approaches to soil and water management. Also, a given area of land can feed more people on a vegan diet than a vegetarian or an omnivorous diet. Studies as to the relative efficiency of vegan diets vary. The amount of usable protein for soy beans is 29 grams per m2, while for meat it is 4 grams per m2.51 This means that one can have 7.25 times more usable protein per area of land if it is used to grow soybeans to feed people, rather than for meat production. At least 50% of all grain is used to feed animals 52, so there is a large opportunity to feed more people, if we had less animal agriculture [11].
Another area that is ripe for innovation with respect to food is the reduction of food waste. According to the Natural Resources Defense Council, up to 40% of food is wasted, and the amount of food waste has increased by 50% from the 1970s.53 This means that it is possible to decrease the amount of food wasted, which has the potential to save money, land, and energy [10].
Keeping Global Warming under 2°C
An international agreement had been reached at Copenhagen that global warming should be limited to 2°C. This is represented by RCP 2.6 (shown in figure 2.6 above). This RCP will be equivalent to CO2 concentration of 450 ppm (with a range of 430–480 ppm). This scenario has emissions peaking by the year 2020, and reducing substantially after that, approaching zero carbon emissions by 2100. The IPCC Summary for Policymakers states:
“Delaying mitigation efforts beyond those in place today through 2030 is estimated to substantially increase the difficulty of the transition to low longer-term emissions levels and narrow the range of options consistent with maintaining temperature change below 2°C relative to pre-industrial levels (high confidence).”
The CO2 equivalent emissions for 2010 were 49 Gt. It will be necessary to reduce these to 22 Gt by 2050. In order to reduce the emissions to zero by 2100, the total emissions up to 2050 will need to be limited to 825 Gt and those between 2050 and 2100 to 125 Gt. To stay within these “carbon budgets” for the rest of this century, the mitigation measures will need to focus on low-carbon electricity, reduced energy use, energy efficiency, and fuel switching [15].
The global temperature records reveal that the earth has become warmer by about 1°C since 1900. International efforts are aiming to limit the increase to 2°C. Different regions are already experiencing the effects of global warming through increased floods, extreme temperatures, droughts, hurricanes, etc. As the temperature continues to rise, further deterioration is to be expected. The world will need to take such deterioration into account in the years to come [15]
Public and private sectors and communities can adapt to the effects of global warming through disaster risk management, public health measures, livelihood diversification, coastal and water management, environmental protection, land planning, sea-level rise planning, etc. Adaptation will need to be embedded in the various planning processes. The following description from table SPM 3 contained in the 2014 IPCC Summary for Policymakers report57 shows various approaches to adaptation and includes examples for each category [27].
Human Development
• Improved access to education, nutrition, health facilities, energy, safe housing and settlement structures, and social support structures; reduced gender inequality and marginalization in other forms.
Poverty Alleviation
• Improved access to and control of local resources; land tenure; disaster risk reduction; social safety nets and social protection; insurance schemes.
Livelihood Security
• Income, asset, and livelihood diversification; improved infrastructure; access to technology and decision-making fora; increased decision-making power; changed cropping, livestock, and aquaculture practices; reliance on social networks.
Disaster Risk Management
• Early warning systems; hazard and vulnerability mapping; diversifying water resources; improved drainage; flood and cyclone shelters; building codes and practices; storm and wastewater management; transport and road infrastructure improvements.
Ecosystem Management
• Maintaining wetlands and urban green spaces; coastal afforestation; watershed and reservoir management; reduction of other stressors on ecosystems and of habitat fragmentation; maintenance of genetic diversity; manipulation of disturbance regimes; community-based natural resource management.
Spatial or Land-Use Planning
• Provisioning of adequate housing, infrastructure, and services; managing development in flood-prone and other high-risk areas; urban planning and upgrading programs; land zoning laws; easements; protected areas.
Structural/Physical
• Engineered and built-environment options: sea walls and coastal protection structures; flood levees; water storage; improved drainage; flood and cyclone shelters; building codes and practices; storm and wastewater management; transport and road infrastructure improvements; floating houses; power plant and electricity grid adjustments.
• Technological options: new crop and animal varieties; indigenous, traditional, and local knowledge, technologies, and methods; efficient irrigation; water-saving technologies; desalinisation; conservation agriculture; food storage and preservation facilities; hazard and vulnerability mapping and monitoring; early-warning systems; building insulation; mechanical and passive cooling; technology development, transfer, and diffusion.
• Ecosystem-based options: ecological restoration; soil conservation; afforestation and reforestation; mangrove conservation and replanting; green infrastructure (e.g., shade trees, green roofs); controlling overfishing; fisheries co-management; assisted species migration and dispersal; ecological corridors; seed banks, gene banks, and other ex situ conservation; community-based natural resource management.
• Services: social safety nets and social protection; food banks and distribution of food surplus; municipal services including water and sanitation; vaccination programs; essential public health services; enhanced emergency medical services.
Institutional
• Economic options: financial incentives; insurance; catastrophe bonds; payments for ecosystem services; pricing water to encourage universal provision and careful use; microfinance; disaster contingency funds; cash transfers; public-private partnerships.
• Laws and regulations: land zoning laws; building standards and practices; easements; water regulations and agreements; laws to support disaster risk reduction; laws to encourage insurance purchasing; defined property rights and land tenure security; protected areas; fishing quotas; patent pools and technology transfer.
• National and government policies and programs: national and regional adaptation plans including mainstreaming; sub-national and local adaptation plans; economic diversification; urban upgrading programs; municipal water management programs; disaster planning and preparedness; integrated water resource management; integrated coastal zone management; ecosystem-based management; community-based adaptation.
Social
• Educational options: awareness raising and integrating into education; gender equity in education; extension services; sharing indigenous, traditional, and local knowledge; participatory action research and social learning; knowledge-sharing and learning platforms.
• Informational options: hazard and vulnerability mapping; early-warning and response systems; systematic monitoring and remote sensing; climate services; use of indigenous climate observations; participatory scenario development; integrated assessments.
• Behavioral options: household preparation and evacuation planning; migration; soil and water conservation; storm drain clearance; livelihood diversification; changed cropping, livestock, and aquaculture practices; reliance on social networks.
Spheres of change
• Practical: social and technical innovations, behavioral shifts, or institutional and managerial changes that produce substantial shifts in outcomes.
• Political: political, social, cultural, and ecological decisions and actions consistent with reducing vulnerability and risk and supporting adaptation, mitigation, and sustainable development.
• Personal: individual and collective assumptions, beliefs, values, and worldviews influencing climate-change responses.
Responding to climate-related risks involves making decisions in a changing world with continuing uncertainty about the severity and timing for climate change impacts and limits to the effectiveness of adaptation. Those decisions can range from nature of strategies (location to a new long-lasting infrastructure) to operational (managing water levels with dams) [10].
Effects of Solid Waste on Climate Change
The estimated total quantity of MSW generated in the world is 1.7–1.9 billion metric tons [19]. Mainly, municipal wastes are not well collected, processed and disposed of in less developed countries, because cities and municipalities cannot cope with the increased rate of waste generation associated with limited financial capacity. Solid waste collection rates in some low-income countries are lower than 70%. Over 50% of the collected solid waste is sometimes disposed of through open landfilling, and about 15% is processed through risky and poor recycling methods [20]. Almost all MSW management processes produce GHGs during collection, transportation, composting, digestion, incineration, and landfill.
MSW management systems are thus a significant source of GHG emissions, contributing about 5% of global GHG emissions in the form of CO2, CH4, and N2O [21]. GHG generated from MSW management is referred to as direct GHG emission. The most significant of which is CH4, gas produced in landfill which is mostly released during the break down of organic matter. Collection and transport of waste cause indirect emission GHG due to the use of fuel for vehicle and from the infrastructure. Biological waste treatments include composting; incineration and anaerobic digestion directly release GHG into the atmosphere [26].
Landfilled organic waste is a major source of CH4 emissions. These emissions are projected to potentially increase fourfold by 2050 compared to 2010 due to further population growth, increased carbon-based energy demand and economic development in low- and middle-income countries [17].
According to the 2006 IPCC guidelines, Solid waste management consists of four sub-categories: solid waste disposal, incineration and open burning, wastewater treatment and biological treatment of solid waste [22]. GHG emissions from solid waste disposal mainly consist of methane generated from anaerobic decomposition of organic material over time in solid waste disposal sites. As such, GHG emissions particularly depend on the quantity of organic matter in the waste.
Global warming potential (GWP) is a relative measure of how much heat a greenhouse gas traps in the atmosphere. GWP and lifetime of GHGs vary based on their source released.
Impact of solid Waste Management Options on Climate Change
Climate change impacts are only one of a number of environmental impacts that derive from solid waste management options. Other impacts include health effects attributable to air pollutants such as NOx, SO2, dioxins and fine particles, emissions of ozone depleting substances, contamination of water bodies, depletion of non-renewable resources, disamenity effects, noise, accidents etc. These environmental impacts are in addition to the socio-economic aspects of alternative ways of managing waste [14].
All of these factors need to be properly considered in the determination of a balanced policy for sustainable waste management, of which the climate change elements are but one aspect. The study is not intended as a tool for municipal or regional waste planning, where local factors, such as the availability of existing waste management facilities and duration of waste management contracts, markets for recyclables, geographic and socio-economic factors, will exert the dominant influence. The study assesses climate change impacts in terms of net fluxes of greenhouse gases from various combinations of options used for the management of MSW [2].
The waste management options considered are
Landfill of untreated waste.
- Bulk untreated MSW is deposited in landfills. Alternative assumptions concerning the control of methane emissions in landfill gas (including the use of gas for electricity generation) are tested in the analysis.
- Incineration. Options assessed include mass-burn incineration of bulk MSW with and without energy recovery (as electricity only and combined heat and power - CHP), refuse-derived fuel combustion and pyrolysis and gasification.
- Mechanical biological treatment (MBT). Bulk MSW, or residual wastes enriched in putrescible materials after the removal of dry recyclables, is subjected to a prolonged composting or digestion process which reduces the biodegradable materials to an inert, stabilized compost residue. The compost, which cannot be used in agriculture or horticulture because of its poor quality, is then landfilled. The treatment results in a significant reduction in methane forming potential of the compost in the landfill compared with untreated waste. Metals are recovered for recycling during the MBT process. Some of the paper and plastics in the incoming waste are diverted from the MBT process. These rejects are sent for either direct landfilling or incineration.
Composting
- Good quality garden and food wastes are segregated at source and composted, producing a bulk-reduced stabilised humus residue of compost that is of sufficient quality to be marketed as a soil conditioner or growing medium in agriculture or horticulture. Options of centralized composting facilities and home composting are considered.
- Anaerobic Digestion (AD).
- Like composting, this option produces a compost residue from source-segregated putrescible wastes for use in agriculture or horticulture. The waste is digested in sealed vessels under air-less (anaerobic) conditions, during which a methane-rich biogas is produced. The biogas is collected and used as a fuel for electricity generation or CHP.
Recycling
- Paper, glass, metals, plastics, textiles and waste electrical and electronic equipment are recovered from the waste stream and reprocessed to make secondary materials. Options are considered for MSW collected in bulk with limited recovery of recyclable materials and for materials segregated at source for more extensive recycling and (in the case of food and garden wastes) composting or AD. In addition to MSW, the study also assesses the greenhouse gas fluxes associated with managing waste electrical and electronic equipment (WEEE) disposed of with the MSW stream. The principal processes quantified in the study that led to positive greenhouse gas fluxes are as follows:
- Emissions of methane from the landfilling of biodegradable wastes (mainly paper and food and garden wastes – the latter known collectively as putrescible waste);
- Emissions of fossil-derived carbon dioxide from the combustion of plastics and some textiles in incinerators;
- Emissions of nitrous oxide during incineration of wastes;
- Emissions of fossil-derived carbon dioxide from the collection, transportation and processing of wastes, from the fuel used in these operations. Emissions of halogenated compounds with high global warming potentials used in WEEE (as refrigerants and insulating foam in fridges and freezers).
- A number of processes lead to negative fluxes of greenhouse gases. These are as follows:
- Avoidance of emissions that would have been produced by other processes – for example:
- Energy recovered from incineration avoids the use of fossil fuels elsewhere in the energy system; recycling avoids the emissions associated with producing materials recovered from the waste from primary resources; use of compost avoids emissions associated with the use of any peat or fertilizer that it displaces. The study also takes account of non-fossil carbon stored (ie sequestered) in the earth’s surface for longer than the 100-year time horizon for global warming adopted for the analysis. The main contributors to carbon sequestration are: slowly degrading carbon stored in landfills receiving untreated biodegradable waste; biodegradable waste stabilized by MBT treatment prior to landfilling, and carbon in compost that is incorporated into stable humus in the soil
- The net greenhouse gas flux from each waste management option is then assessed as the sum of the positive and negative fluxes. The study has also gathered information on the costs of alternative waste management options.
The conclusions are as follows:
- eq/tone of MSW, depending on whether or not the negative flux credited to carbon sequestration is included.
- eq/tone MSW, compared with landfilling untreated waste. For these materials, the benefits are essentially independent of landfill standards and carbon sequestration.
- eq/tone MSW) is MBT (including metals recovery for recycling) with landfilling of the rejects and stabilized compost. MBT with incineration of rejects (energy recovered as electricity) gives a smaller net negative flux of about 230 kg CO2 eq/tone. Mass-burn incineration where half the plants operate in electricity only and half in CHP mode gives a net negative flux of about 180 kg CO2 eq/tone MSW. If all the incineration capacity were assumed to operate in CHP mode, then the net flux from incineration would be almost the same as from MBT with landfill of rejects. On the other hand, energy recovery from incineration as electricity only would produce a net flux of only –10 kg CO2 eq/tone. These figures are based on EU-average landfill gas control, inclusion of carbon sequestered in MBT compost after landfilling and the replacement of electricity and heat from EU-average plant mix.
- eq/tonne MSW. Incineration is unaffected by assumptions on carbon sequestration.
- 2emission factor representative of average EU power and heat sources. For electricity, there has been an increasing trend to combined cycle gas turbine technology in recent years, but this has not been assessed separately because the emission factor from this technology is very close to average plant mix. Two alternatives to replacement of ‘average’ electricity are considered. They are (a) replacement of coal-fired power generation, and (b) replacement of electricity generated from renewable sources – in this case wind. The example given in (a) could come about, for example, from the accelerated retirement of an old coal-burning power station due to the commissioning of new incineration capacity, or through the use of RDF as a coal substitute. Example (b) may result from the inclusion of energy from waste (ie incineration) technology within a member state’s target for renewable energy – as is the case in the UK. The greater the CO2 emission factor of the replaced generation source, the greater the emission saved due to its replacement by incineration.
- 2 eq/tonne MSW, with equal proportions of power only and CHP incineration capacity. Under these circumstances, mass-burn incineration would give practically the same emission saving as recycling and composting of source segregated materials. With all incinerators in CHP mode, mass-burn incineration would be the best overall option in terms of greenhouse gas flux. Combustion of RDF as a coal substitute in power stations or cement kilns gives rise to a net negative greenhouse gas flux of about half this sum.
- eq/tonne MSW, which makes it the best option for non-source segregated wastes. MBT with incineration of rejects gives a net negative flux of about 150 kg CO2 eq/tonne MSW. These comparisons are on the basis of sequestered carbon being included in the overall flux from the MBT options.
- eq/tonne MSW), whilst that for MBT with incineration is much higher, at about 135 kg CO2 eq/tonne MSW.2 eq/tonne in 2000 to a negative flux of almost 200 kg CO2 /tonne in 2020. Even if achievement of the directive’s target is delayed until 2020 (rather than 2016), then a negative flux of about 140 kg CO2 eq/tonne results. Further reductions in greenhouse gas fluxes (to about –490 kg/CO2 /tonne) could be achieved through investment in recycling, incineration with CHP and MBT. Alternatively, a scenario with no incineration and maximum biological treatment of waste achieves an overall greenhouse gas flux of –440 kg CO2 eq/tonne.
Adaptation of Climate Change Effects on the Waste Sector
Compared to other sectors, the relevance of sustainable waste management for climate change mitigation might seem relatively easy. However, mitigation activities in the waste sector can have significant impacts on GHG emissions generated and reported in other sectors such as the energy and industry sector. International and national efforts towards climate-friendly waste management should follow the waste management hierarchy. It priorities waste prevention, reuse, recycling (including composting) and energy recovery from waste before landfilling and open dumping or burning [25]. Global Waste Management Outlook estimates that around 10-15% of global GHG emissions could be reduced through improved waste management following a life-cycle assessment approach [10].
Solid Waste Management and Environment
Nature exists in a balance. The most difficult challenge facing man is not exploiting nature, but maintaining this critical balance while doing so. Massive exploitation of the earth crust has provided man with endless natural resources which are constantly being transformed into products that are discarded as waste after serving their purpose. Unfortunately, man cannot return these waste products to their crude state in the earth crust; hence the easiest route of escape is to release these materials to the atmosphere in gaseous forms. The accumulation of these gases in the atmosphere over many years has upset a critical balance of nature [19].
The issue of global warming and climate change will continue to be a threat until man learns to return used or waste products to their crude states. Obviously, this is impossible and the closet that man can ever come to that is recycling and reuse [17]. The most popular contributor to global warming via gaseous emission into the atmosphere is the burning of fossil fuel. Recently, concerted efforts are being made, especially in developed nations, to reduce dependence on fossil fuel as a means to reduce global warming. However, a silent but massive contributor to greenhouse gases is waste management.
A recent report by the United States Environmental Protection Agency estimates that 42% of total greenhouse gas emissions in the US are associated with the management of waste materials [10]. Figure 2 shows the contributions of these gases to global warming and a simple analysis reveals that activities associated with waste and waste management contribute a total of 57% of CH4 emission compared with 26% contributed by energy production. It would seem that CO2 is the most critical greenhouse gas by looking at the figure but a large portion of CO2 emission comes from treating food waste and is of no consequence to global warming because it is biogenic meaning that it was atmospheric CO2 before it was fixed by plants [13]. Figure 5
Figure 5: Contribution of Different Gases to Global Warming (Illustrated with data from Intergovernmental Panel on Climate Change report).
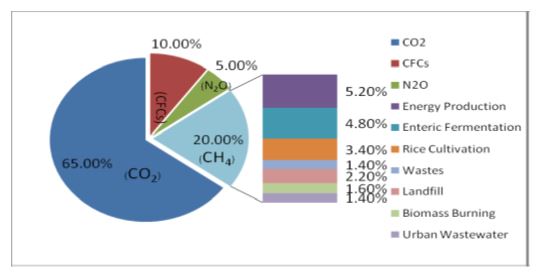
Waste management options such as landfill, composting, incineration / mass burns and anaerobic digestion / biogas plants collectively emit substantial amount of greenhouse gases. Composting makes use of micro-organisms to oxidize biodegradable wastes (especially food and garden waste) to CO2 and water vapor, using oxygen in the air as the oxidizing agent. Anaerobic decomposition converts biodegradable carbon to biogas, which consists of about 65% CH4 and 34% CO2 with traces of other gases. In landfills, microbes gradually decompose organic matter over time producing roughly 50% of CH4 and 50% of CO2 and trace amount of other gaseous compounds. Methane emissions from landfill represent the largest source of greenhouse gas emissions from the waste sector, contributing around 700 Mt CO2-e for 2009 followed by incineration, estimated to contribute around 40 Mt CO2-e (UNEP, 2009). Global warming potential of waste management can be reduced by a combination of sorting, bio gasification, incineration and landfilling (see Figure 3). Global warming potential (GWP) is a factor that allows the concentrations of greenhouse gases to be expressed in terms of the amount of CO2 that would have the same global warming impact (Smith, Brown, Ogilvie, Rushton & Bates, 2001). GWP is expressed as carbon dioxide equivalent (CO2e) over a specific time horizon, say 21 years, 100 years or 500 years. Methane (CH4) is estimated to have a GWP of 25, whereas carbon dioxide (CO2) and nitrous oxide (N2O) have GWPs of 1 and 310 respectively. Incineration has a lower global warming potential because, the heat generated can be diverted as a source of energy in the place of fossil fuel. Even though the global warming potential of landfill can be reduced by trapping the methane and using it as a source of energy, some of the gas will still escape and, of course, the accompanying CO2 has no energy potential (see Figure 4). There is also additional capture of carbonaceous materials by the soil (sequestration). Use of compost may also have beneficial effects on greenhouse gas fluxes by replacing other products like fertilizer and peat; and may also lead to increased storage of carbon in the soil. Furthermore, the major greenhouse gas from incineration is CO2 while the major greenhouse gases in landfill are CH4 and CO2. CH4 has a global warming potential which is twenty-one times higher than that of CO2, hence the higher emission factor of landfill. Figure 3 shows vividly that the global warming potential of both incineration and landfill can be reduced by employing a wholesome waste management strategy involving sorting. Sorting ensures that waste materials are segregated into generic forms for ease of recycling, treatment and subsequent disposal. In the case of incineration, sorting helps ensure that recyclable combustible materials such as plastic, tyre and paper are excluded from the incinerator, hence lowering global warming potential. It can be clearly seen from Table 1 that the CO2 from incineration and decomposition of organic matter in landfills and composting plants is short cycle and has no global warming potential as opposed to the CO2 from burning of fossil fuel [14].
Positive sign implies contribution to global warming while negative sign indicates a counteracting effect on global warming. It should be noted that CO2 emission is common to all four options viz: landfill, composting, incineration and anaerobic digestion. However, the CO2generated by composting, anaerobic digestion and landfills is biogenic and hence has no global warming potential. Landfill and composting offer an exceptional advantage of carbon sequestration. Carbon sequestration is a viable means of replenishing carbon composition of the earth crust as well as reducing greenhouse gas emission. The global warming potential associated with landfills depends on whether biogas is captured or not. Biogas which is a combination of methane and carbon IV oxide is a replacement for fossil fuel. Methane from landfills is of organic origin and therefore has low global warming potential compared to other greenhouse gases. It is obvious that composting has no global warming potential because the CO2 released during decomposition is of organic origin and is therefore biogenic [24]. In many developing countries compost is sold to farmers for soil amendment. Incineration provides energy in the form of heat thereby reducing requirement for fossil fuel, but it has the disadvantage of releasing greenhouse gases of high global warming potentials into the atmosphere [13].
Managing and Utilizing Solid Waste
Municipal solid waste (MSW) management is inextricably linked to increasing urbanization, development, and climate change. The municipal authority’s ability to improve solid waste management also provides large opportunities to mitigate climate change and generate co-benefits, such as improved public health and local environmental conservation [11].
Driven by urban population growth, rising rates of waste generation will severely strain existing MSW infrastructure in low and middle-income countries. In most of these countries, the challenge is focused on effective waste collection and improving waste treatment systems to reduce greenhouse gas (GHG) emissions. In contrast, high-income countries can improve waste recovery through reuse and recycling and promote upstream interventions to prevent waste at the source [29].
Up to 3–5% of global GHG emissions come from improper waste management. The majority of these emissions are methane – a gas with high greenhouse potential – that is produced in landfills. Landfills, therefore, present significant opportunities to reduce GHG emissions in high- and middle-income countries [21].
Reducing GHG emissions in the waste sector can improve public health; improve quality of life; and reduce local pollution in the air, water, and land while providing livelihood opportunities to the urban poor. Cities should exploit the low-hanging fruit for achieving emissions reduction goals by using existing technologies to reduce methane emissions from landfills. In low and middle-income countries, the best opportunities involve increasing the rates of waste collection, building and maintaining sanitary landfills, recovering materials and energy by increasing recycling rates, and adopting waste-to-energy (WTE) technologies. Resource managers in all cities should consider options such as reduce, re-use, recycle, and energy recovery in the waste management hierarchy [25]. Figure 6
Figure 6: Integrated Sustainable Waste Management.
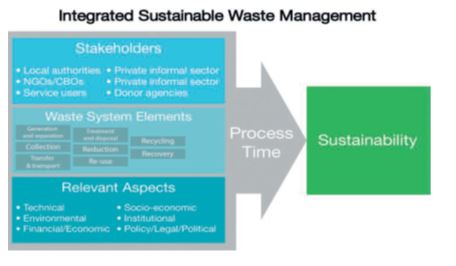
GHG Mitigation Potential of Sustainable Waste Management
MSW management activities like collection, transportation, treatment, and disposal generate GHG emissions. The majority of GHGs are emitted during the disposal phase in sanitary landfills and dumpsites. Comparatively, GHG emissions from other activities like collection, transportation, and treatment are low. In principle, all these activities entail the movement of waste from the generation point to other facilities, which involves the use of different sources of energy and fuels, thus potentially resulting in GHG emissions. Other sources of GHG emissions involve compaction of waste and maintenance of waste collection and transport equipment including bins, containers, and vehicles, as well as construction of infrastructure and facilities. The following subsections highlight some of these sources [20].
Globally, it is expected that waste generation per capita will increase by approximately 30% from current levels, while total MSW generation will increase almost threefold [15]. With increasing waste generation also comes an increasing amount of biodegradable organic waste, which in turn leads to increased GHG emissions due to anaerobic decomposition in landfills and dumpsites. Waste prevention seems to be a promising approach to minimize the amount of waste. Reducing waste through product design and reusing materials and through concepts like circular economy hold enormous potential for indirect, reduction of GHG emissions through the conservation of raw materials, improved energy and resource efficiency, and fossil fuel avoidance [9]. With improved material management that uses a combination of reduced packaging, reduced use of non-packaging paper products (e.g., magazines, newspapers, and textbooks), and extended life of personal computers in U.S. industry, high amounts of GHG emissions reduction, up to 255 MMT CO2e per year can be achieved [10].
Waste prevention and reduction can also mitigate GHG emissions through:
- Substituting virgin raw material and reducing GHG emissions from virgin raw material procurement and manufacturing (i.e., avoiding baseline emissions attributable to current production)
- Forest carbon sequestration, in the case of paper products (also treated as negative emissions)
- Zero waste management GHG emissions
GHG Emissions, Waste Sorting, and Collection
Considering the high number of mixed wastes disposed of in developing countries, high amounts of GHG emissions are generated from the degradation process of biodegradable waste. Source separation of organics from other waste streams therefore provides great potential for reducing GHG emissions from landfill sites. The study of MSW practices in China indicates the possibility to reduce about 23% of GHG emissions through source-separated collection compared with the existing practice using a mixed waste collection system [16].
Collection systems involve both mechanical and manual handling of waste. While collection systems with a higher degree of manual handling reduce GHG emissions, they might have other drawbacks that also need to be considered. In estimating the GHG emissions associated with waste collection, only the energy used when operating the collection trucks is considered.
GHG Emissions and Transportation of Waste
GHG emissions from the transportation of waste also depend on the density of the material transported and the degree of compaction it was subjected to. Modern materials like plastic, paper, and cardboard have low density but are more compactable than are metals or organic and inorganic materials that have a higher density. Studies by[14] show that fuel consumption is higher for materials with low density when assessed per ton of material transported.
More obvious factors that influence GHG emissions from transportation are the distance between the waste generation source and final disposal site and the size of the waste container. The bigger the size of the container, the less the GHG emissions rate per tons of waste transported per kilometer. An extreme case of GHG emissions from waste transportation is small cars and motor carts transporting small amounts of waste over the road, but such modes are used around the world where collection and transportation services are inadequate or expensive [14].
GHG Emissions and Recycling
The GHG emission benefits from recycling are quite substantial as compared to other methods of waste management. Recycling can potentially reduce emissions because less waste is brought to the landfill and fewer virgin resources are extracted, hence the energy required for extraction and processing of primary resources is reduced. A comparative study of treatment practices in the Netherlands shows that high-quality recycling saves 2.3 Mt CO2 per year, which is higher than that achieved from improved efficiency incineration systems, which could reduce only 0.7 Mt CO2 per year [19]. Table 15.6 demonstrates the potential GHG emission reduction from recycling activities. In 2002, Canada recycled 4.3 milliontons of materials, avoiding 12 million tons of GHG and saving 6.3 million G J of energy (0.4 million barrels of oil).
GHG Emissions and Waste Treatment and Disposal Practices
Anaerobic Digestion: GHG emissions from anaerobic digestion facilities are generally limited to system leaks from gas engines used to generate power from biogas, fugitive emissions, and CO2 from combustion methane, and during system maintenance. There are also possible traces of methane emitted during maturation of the solid organic output. Anaerobic digestion requires energy input but is generally self-sustaining and can make several contributions to climate change mitigation.
First, digesters capture biogas or landfill gas that would have been emitted anyway because of the nature of organic waste management at the facility where the digester is in operation. Second, the displacement of fossil fuel–based energy that occurs when biogas is used to produce heat or electricity is an important contribution. Finally, GHG emissions are also reduced when the nutrient-rich digester created from anaerobic digestion is used to displace fossil fuel–based fertilizers used in crop production. This digestate can make a natural fertilizer that is produced with renewable energy as opposed to fossil fuels [14]
Anaerobic digestion can be well-suited to source-separated food wastes, particularly in developing countries where MSW contains 50% or more of food wastes, once the technological challenge the method imposes is surmounted. A critical impediment to its adoption in the developing world is the cost of separate collection and the initial capital investment, which is more than US$500 per ton of installed annual capacity [13]. This is true to the extent that, even in rich countries, it is not adopted on a large scale since the energy yield is around 0.2 MWhe per ton of organic waste compared with waste-to-energy (WTE) high-efficiency plants that can reach 0.8 MWhe per ton if mixed waste is used (no need to collect separately).
Aerobic Composting: Aerobic composting refers to the degradation of organic waste by micro-organisms in a controlled environment and in the presence of oxygen to produce a stable product – compost. The process, which is ineffective for the management of MSW high in plastics, metals, and glass content, can directly emit varying levels of gases including nitrous oxide, depending on how the closed system is managed. A review of several studies shows that MSW composting emits 0.12–9 kilograms methane per ton of treated waste and 0–0.43 kilogram N2O-N per ton of treated waste [9].
Composting is suited as a waste management technology in developing countries that have a high portion of biodegradable waste, but to date composting is mostly practiced in developed countries. In 2010, the fraction of MSW composted in Austria was more than 30%, whereas in Belgium and the Netherlands, it was greater than 20% [4]. Most composting processes tend to be unsuccessful in developing countries due to the composting of commingled instead of segregated MSW, resulting in poor-quality compost. Composting output, which can be used as a substitute for the primary production of fertilizers, provides environmental benefits, yet it is beset with problems of quality and market for the products [7].
Waste-to-Energy: There are more than 800 WTE power plants worldwide producing electricity and district heating by combusting waste. In Switzerland, Japan, France, Germany, Sweden, and Denmark, more than 50% of the waste that is not recycled is sent to WTE industries thereby reducing the amount of waste disposed of in landfills to as little as 4% of the total waste generated [4]. Incinerators that do not generate energy are net energy users and contribute to GHG emissions. In that respect, incineration without energy recovery is not [7]. Advanced thermal treatment technologies, such as gasification and pyrolysis, may emit fewer GHG emissions compared to mass-burn incineration, and even negative GHG emissions if the energy produced by thesetechnologies is taken into account. This is clearly shown in the assessment of global warming potential from different treatment technologies in Aalborg. The shift to incineration technology with energy recovery significantly reduced about −400 kgCO2e per ton of waste, compared to the use of incineration without energy recovery, which emitted 251.5 per ton of waste [14].
Landfill Gas-to-Energy: Methane generated in landfills may be flared, which reduces emissions into the atmosphere. If captured, methane can be burned to produce energy, thereby offsetting emissions from fossil fuel consumption [31] These landfill sites with flaring and electricity generation emit much less GHGs than those without gas collection. A study of direct GHG emissions from South African landfill sites show that about 40–75 kg CO2e per ton of waste can be saved by disposing of MSW in landfill sites with flaring or energy recovery instead of general landfill sites [17].
Landfill gas-to-energy (LFGTE) is the most economical method to reduce GHG emissions from MSW when compared to all other treatment and disposal alternatives (see Table 15.7). LFGTE provides the highest potential to reduce GHG emissions at a cost of less than US$10 per t CO2-eq. This potential rests mainly in non-OECD countries where financing waste management can provide many other co-benefits.
Landfilling: The organic content in waste sent to landfill (e.g., food, biomass, paper) naturally decomposes under anaerobic conditions. The decay, usually initiated by bacteria and microbes, can lead to the production and release of GHGs such as methane, carbon dioxide, and some trace gases that are environmentally unfriendly. Indeed, such emissions can persist for half a decade and more after waste has been disposal of [15] The situation in most developing countries is worrying because most landfills do not include high-quality liners, leak detection leachate collection systems, or adequate gas collection and treatment systems [1]. For biodegradable waste, landfills are the largest emitters of GHG compared to other treatment systems.
The landfill option emitted nearly 1,200 kilograms of CO2 for 1 ton of food waste in the European Union in 2008 while composting emitted negligible amounts of GHG. Further decreases in GHG emissions from treating biodegradable waste can be achieved from incineration, home composing, and anaerobic digestion.
Impacts of SWM on Climate Change
Generally, post-consumer waste is a small contributor to global GHG emissions, estimated at approximately 3–5% of total anthropogenic emissions or less than 50% with total emissions of approximately 1,300 Mt CO2eq in 2005 [7]. The actual magnitude of these emissions in current terms is difficult to determine due to poor data on global waste generation, composition, and management as well as inaccuracies in emission models. The OECD nations, however, have an installed WTE capacity of more than 200 million tons of MSW and also 200 million tons of sanitary landfilling that either uses or flares an estimated 59% of the methane emitted. Developing countries, on the other hand, dispose of an estimated 900 million tons of MSW in non-sanitary landfills and waste dumps.
Formal and Informal Recycling and Climate Change
Most developing countries face increasing challenges when it comes to waste recycling. While formal recycling programs appear to be the most plausible option, their applicability and practicality are complicated by a number of drawbacks such as technology, cost, and institutional inadequacies, among others [14]. As a result, the most popular option is the use of informal and rudimentary approaches, mechanism, and practices where reusable and recyclable material are gathered at the individual, family, and household levels by poor scavengers who make a good business from their activities even if they are overly exploited by middlemen and well-organized pickers and unions/associations [9].
Naturally, the activities of these formal and informal recycling sectors not only improve public health and sanitation but also guarantee environmental sustainability by way of reduced GHG emission. Additionally, the informal subsidy of SWM necessarily saves scare capital needed by city authorities for other pressing development issues. A recent UN report has regretted how some city and municipal authorities in developing countries continue to exploit waste gatherers who collect between 50% and 100% of MSW at no cost [19]
Landfills and Climate Change Mitigation
There are two major strategies to reduce landfill methane emissions: implementation of standards that require or encourage its recovery and a reduction in the quantity of biodegradable waste that is landfilled [9] In some instances, methane reduction efforts are complicated by countries that wish to trade their recovery standard for economic gains. This is particularly true in the case of the United Kingdom where the Non-fossil Fuel Obligation, which was meant to generate electricity per a certain standard, instead led to a compromise in the 1980s and 1990s. Also, periodic tax credits in the United States have provided an economic incentive for landfill gas utilization.
Climate Change Adaptation and SWM
Scholarly literature on the impacts of climate change on SWM is limited. However, a number of studies have been carried out in recent years by the development community showing that climate change can significantly impact SWM services both directly and indirectly [10] It can directly affect SWM through the impacts to the waste management infrastructure and, indirectly, through the changes that would occur to the surrounding environment.
For example, elevated temperatures and changes in hydrology could increase odor, litter, and decomposition rate, and may necessitate more frequent waste collection and better landfill management (to prevent leachate, landfill degradation). Similarly, extreme climate events (e.g., flooding, rainfall, erosion, sea level rise, storm surge) could affect the critical infrastructure (transport means, buildings, machinery) necessary for waste collection, transfer, disposal, and recycling [31]. These are just examples; the impacts would differ from city to city depending on the extent of impact, location, current practices of waste management, and prevailing infrastructure. Therefore, accessing the risks of climate change to waste management processes and sites at the early stage is very helpful.
Carbon Market and Finance for GHG Mitigation from Waste
For an effective integrated solid waste management program, behavioral, technological, and management elements are essential, which necessitates new and innovative policies, better institutional coordination, and effective financial arrangements. Some of the policy strategies, which are also linked to financial mechanisms. Different modes of financing for waste management are possible, however, in the context of climate change mitigation, and many studies in the scholarly as well as the development community have already shown that this sector is a cost-effective and “low-hanging fruit” in the entire portfolio of climate change mitigation options. Therefore, in climate change–related projects and financing systems, the waste sector has attracted many projects. In the global architecture of carbon markets and financing, the CDM, a flexible mechanism of the Kyoto Protocol, is prominent SWM project type. By the end of 2012, issued carbon credits (CERs) from 407 landfill gas projects under CDM amounted to 71 million.2 [14] reported a total of 350 SWM CDM projects globally (by May 2015), of which 102 CDM projects (12.8 mn t CO2eq) were in China followed by 45mprojects in Brazil (10.6 mn t CO2), and 28 projects in Mexico (3 mn t CO2e).
Summary
From the foregoing, it is logical to summarize that Climate change is the most important and dangerous, and certainly the most complex global environmental issue to date. Apart from direct threat to lives and the environment, climate change is a serious setback to sustainable development. Climate change is thought to be the culprit responsible for some of the recent environmental problems the world over, most prominent of which are severe flooding in parts of Asia and America, droughts in parts of Africa and the global food crises which gave rise to civil unrests in many parts of the world. Even though the current global economic recession has been blamed on unscrupulous economic practices, proper scrutiny may reveal that climate change has a hand in it.
Rising levels of greenhouse gases in the Earth's atmosphere are causing changes in our climate, and some of these changes can be traced to solid waste. The manufacture, distribution, and use of products-as well as management of the resulting waste-all result in greenhouse gas emissions. Waste prevention and recycling are real ways to help mitigate climate change. Almost every waste management step generates greenhouse gas (GHG) emissions; hence, it is imperative to design appropriate treatment methods from sources to disposal sites for reducing their environmental impact. Anthropogenic GHGs surely affect climate change; hence, GHGs have attracted research attention since the beginning of the 20th century. The Intergovernmental Panel on Climate Change (IPCC) has stated that if action is not taken to prevent the continual increase of GHG emissions, the Earth's temperature will increase by 6.4 °C during the 21st century.
Our review of the investigations of the impacts of solid waste on greenhouse gas emission reveal that Waste management technologies, such as energy generation via landfill gas recovery, landfill bioreactors, aerobic composters, anaerobic digesters, incineration with energy recovery, refuse-derived fuel, and co-combustion in cement kilns, have been developed in several countries to curb GHG emissions in this sector. Policies such as the restriction of uncontrolled waste dumping sites in several developing countries; phase reduction of waste entering landfills in the European Union; incentives to generate energy via landfill gas recovery in the United Kingdom; and the requirement of landfill gas recovery at large landfill sites in the United States are also being introduced to achieve this goal.
In addition, effects of algal density, types of algae used were explored in detail, which have provided comprehensive understanding of the interaction between bioaccumulations of algae and mechanisms of uptake of the pollutants. Phytoremediation’s of algae have been reviewed for various sites with different compositions of algae and its density. Moreover, the bioaccumulations factor of different algae was proven successful in detoxifying the water, waste water from the pollutions of Arsenic and Boron.
References
- Solid Waste Management at the Crossroads; Franklin Associates, Ltd.: Prairie Village, KS, December 1997.
- Lackner, Klaus S, Christophe Jospe (2017) “Climate Change is a Waste Management Problem.” Issues in Science and Technology 33: 3.
- Goldenfum JA (2012) Challenges and solutions for assessing the impact of freshwater reservoirs on natural GHG emissions. Ecohydrol Hydrobiol 12: 115–22. [crossref]
- Intergovernmental Panel on Climate Change (IPCC). Climate change 2013: The physical Science basis. Working Group, I contribution to the IPCC Fifth Assessment Report. Cambridge, United Kingdom: Cambridge University Press.
- Gabriel Andari Kristanto, William Koven (2019) Estimating greenhouse gas emissions from municipal solid waste management in Depok, Indonesia Journal of City and Environment Interactions 4 100027.
- Tchobanoglous G, Theisen H, Vigil SA (1993) Integrated solid waste management: engineering principle and management issue. New York: McGraw-Hill.
- Intergovernmental Panel on Climate Change (IPCC). In: Metz B, Davidson OR, Bosch PR, Dave R, Meyer LA, editors. Climate change 2007: Mitigation. Contribution of Working Group III to the fourth assessment report of the Intergovernmental Panel in Climate Change. Cambridge, United Kingdom and New York, NY, USA: Cambridge University Press.
- Damanhuri E, Wahyu IM, Ramang R, Padmi T (2009) Evaluation of municipal solid waste flow in the Bandung metropolitan area, Indonesia. J Mater Cycles Waste Management 11: 270–276. [crossref]
- Gichamo T, Gökçekus H (2019) Interrelation between Climate Change and Solid Waste. J Environmental Pollution Control 2: 104.
- USEPA (United States Environmental Protection Agency). Background Information Document for Updating AP42 Section 2.4 for Estimating Emissions from Municipal Solid Waste Landfills. Office of Research and Development.
- Chidozie C, Joseph T (2011) Climate Change and Waste Management: A Balanced Assessment. Journal of Sustainable Development in Africa 13: 7.
- Muchangos LS dos, Tokai A (2020) Greenhouse gas emission analysis of upgrading from an open dump to a semi-aerobic landfill in Mozambique –the case of Hulene dumpsite Scientific African 10.
- Oteng-Ababio M, Annepu R, Bourtsalas A, Intharathirat R, Charoenkit S, et al. (2018) Urban solid waste management. In Rosenzweig C, W Solecki, P Romero-Lankao, S Mehrotra, S Dhakal, S Ali Ibrahim (eds.), Climate Change and Cities: Second Assessment Report of the Urban Climate Change Research Network. Cambridge University Press. New York. 553–582
- Chen Y-C, Lo S-L (2016) Evaluation of greenhouse gas emissions for several municipal solid /waste management strategies. J Clean Prod 113: 606–612.
- Intergovernmental Panel on Climate Change (IPCC) (2006) Chapter 4 biological treatment of solid waste. 2006 IPCC guidelines for national greenhouse gas inventories volume 5 waste.
- Quirós R, Villalba G, Muñoz P, Colón J, Font X, et al. (2014) Environmental assessment of two home composts with high and low gaseous emissions of the composting process. Resource Conservation Recycling 90: 9–20.
- Department for Environment, Food and Rural Affairs (DEFRA). Guidelines to Defra/ DECC’s conservation factors for company reporting 2011.
- Intergovernmental Panel on Climate Change (IPCC). Chapter 5 incineration and open B8urning of waste. 2006 IPCC guidelines for national greenhouse gas inventories volume 5 waste; 2006.
- Mohareb AK, Warith MA, Diaz R (2008) Modelling greenhouse gas emissions for municipal solid waste management strategies in Ottawa, Ontario, Canada. Resource Conservation Recycling 52: 1241–1251.
- Manfredi S, Tonini D, Christensen TH, Scharff H (2009) Landfilling of waste: accounting of greenhouse gases and global warming contributions. Waste Management Res 27: 825–836.
- Sagala GAA (2017) The effect of domestic solid waste composition on calorific value optimization of refuse derived fuel through bio drying. Department of Civil and Environmental Engineering, Universitas Indonesia.
- Yi S, Jang Y-C, An AK (2018) Potential for energy recovery and greenhouse gas reduction through waste-to-energy technologies. J Clean Prod 176: 503–511.
- Climate Change and Resource Sustainability an Overview for Actuaries Canadian Institute of Actuaries. Online Research Paper.pdf August 2015 Document 215068
- Fischer G, M Shah, H van Velthuizen (2002) Climate Change and Agricultural Vulnerability. Vienna: International Institute of Applied Systems Analysis.
- Forest CE, PH Stone, AP Sokolov, MR Allen, MD Webster, et al. (2002) “Quantifying Uncertainties in Climate System Properties with the Use of Recent Climate Observations.” Science 295:113-117.
- Frederick KD, GE Schwarz (1999) “Socioeconomic Impacts of Climate Change on U.S. Water Supplies.” Journal of the American Water Resources Association 35: 1563-1583.
- Gitay H, S Brown, W Easterling, B Jallow (2001) “Ecosystems and their Goods and Services” In Climate Change 2001: Impacts, Adaptation, and Vulnerability, J. McCarthy, O. Canziani, N. Leary, D. Dokken, and K. White (eds.). New York: Cambridge University Press 235-342.
- Glantz MH (1988) Societal Responses to Regional Climatic Change — Forecasting by Analogy. Boulder, CO: Westview Press.
- Halpin PN (1997) Global Climate Change and Natural Area Protection: Management Responses and Research Directions. Ecological Applications 7: 828-843.
- Hijioka Y, K Takahashi, Y Matsuoka, H Harasawa (2002) Impact of Global Warming on Waterborne Diseases. Journal of Japan Society on Water Environment 25: 647-652.
- Hay JE, Sem G (2000) GHG Inventories in PICCAP Countries: Evaluation and regional synthesis of national greenhouse gas inventories: General assessment and regional synthesis. Apia: SPREP.
- Otoma S, Hoang H, Hong H, Miyazaki I, Diaz R (2013) A Survey on Urban Solid Waste and Residents’ Awareness in Da Nang City, Vietnam. Journal of Material Cycles and Waste Management 15: 187-194.
- Jha AK, Sharma C, Singh N, Ramesh R, Purvaja R, et al. (2008) Chemosphere. 71: 750-758.