Investigation of Polyurethane and Silica Influence in Cement Slurries That Were Exposed to High Temperatures
Ítalo Batista da Silva1*
1 Laboratório de cimentação de poços, Universidade Federal do Rio Grande do Norte – UFRN, Natal, Rio Grande do Norte, Brazil, CEP: 59064-970.
*Corresponding Author: Ítalo Batista da Silva, Laboratório de cimentação de poços, Universidade Federal do Rio Grande do Norte – UFRN, Natal, Rio Grande do Norte, Brazil, CEP: 59064-970, TEL: ; FAX: ;E-mail:italo.batista@ifrn.edu.br
Citation: Ítalo Batista da Silva (2019) Investigation of Polyurethane and Silica Influence in Cement Slurries That Were Exposed to High Temperatures. Nano Technol & Nano Sci J 2:107.
Copyright: © 2018 Ítalo Batista da Silva, et al. This is an open-access article distributed under the terms of the Creative Commons Attribution License, which permits unrestricted use, distribution, and reproduction in any medium, provided the original author and source are credited
Received date: January 05, 2019; Accepted date: March 01, 2019; Published date: March 04, 2019.
Abstract
Researchers and scientists goes through many challenges in order to investigate processes in the oil industry. Therefore, the researches aimed to the oil industry structuring, more specifically in the wells cementation area, have a fundamental importance for the economy of nations that have oil production as main profits source. Cementation is an extremely important work for the drilling and oil well completion phases, resulting in a major impact on the well productivity. Cyclic steam injection is a technique applied to reduce the viscosity of a heavy oil reservoir, increasing the mobility and subsequently, its production. The cement sheath has a major role in the oil well, promoting stability, liner support and corrosion protection, what prevents the fluid communication between zones. The oil well integrity is essential and a key point on the development and exploitation of heavy oil reservoirs. When exposed to high temperature conditions, the Portland cement hydrated products undergo by a process of chemical and microstructural transformation in its material. Thus, the main objective of this work is to study the effect of polymer (polyurethane-PU) in different concentrations and 40% of silica in cement slurries submitted to the high temperature of 300° C through X-ray diffraction (XRD) and scanning electron microscopy (SEM-FEG ZEIZZ) analyses in cement pastes prepared and cured for 14 days.
Keywords
Petroleum. Cementation. Steam injection. Polyurethane. Silica.
Introduction
Researchers and scientists encounter many challenges during their studies for the oil industry. In the past, the decisions were made in a simple and intuitive way due to the availability of large reservoirs of oil and gas [1]. The construction of a research aimed to the structuring of the oil industry, more precisely regarding well cementation, have a fundamental importance for the economy of nations that have oil production as main profit source. Cementation is an extremely important work for the drilling and oil well completion phases, resulting in a major impact on the well productivity.
A special Portland cement is used for deep well cementations, steam injection wells or geothermal wells are known for present a regression force behavior in the paste when exposed to critical temperatures above 230° F (~110° C). This regression force reduces the cement compressive strength over time and increases its porosity and permeability of the paste. The cyclic steam injection is an efficient process used for production of heavy oil and bitumen.
According to Costa et al. [2] (2017) the method of steam injection is applied to reduce the viscosity, increase mobility and subsequently increase heavy oil production. Thermal methods have been widely used in many projects of heavy oil recovery around the globe, as for example: Kern Field in California, USA; Mene Grande in Venezuela; Athabasca Oil Sands in Alberta, Canada; Surplacul of Barcau in Romania and in the Northeast region of Brazil). [3] (apud Curtis et al., 2002; PanaitPatricia et al., 2006)
In an oil well, right after the drilling phase, a liner pipe is set up and the annular space between it and the rock formation is filled with cement, forming a sheath. This cement sheath has a major role in the oil well, promoting stability, liner support and corrosion protection, also preventing fluid communication between zones. The oil well integrity is an essential connection and a key point on the development and exploitation of heavy oil reservoirs. According to Bu et al. [4] (2017), the cement sheath integrity is crucial to the well integrity and zonal isolation, preventing the flow of unwanted fluids, such as oil, gas or steam to the well.
Most components of the Portland cement are tricalcium silicate (C3S mineral) and dicalcium silicate (C2S). When water is add to the cement, it forms a moisturized slurry denominated C-S-H phase, which is the initial product of hydration.
However, when exposed to temperatures that exceed 110° C, the physical and chemical properties of the common Portland cement used to build the sheath suffer significant changes. If the material is not properly designed to withstand high temperatures, the cement strength and permeability can be reduced or increased, this phenomenon occurs in the C-S-H phase and it was described and denominated retrogression by Swayze in 1954 [5].
The retrogression problem can be prevented by the adding 35% up to 40% of silica in the cement slurry. However, some works such as [6-8] presented the appearance of fissures in the cement sheath even using pastes with silica contents,, generated due to tension resulted by the application of steam and the variation of pressure inside the well.
The behavior investigation of Portland cement at high temperatures through the development of cement pastes that have properties to support such conditions has a fundamental importance. Some studies performed in works of [2,9-11] (BALOCH, 2006) studied the addition of numerous kinds of additives, such as artificial and mineral fibers, different proportions of silica, polymers, latex and others to cement slurries withstand high temperatures.
When exposed to high temperature condition, the hydrated Portland cement products undergo a process of chemical and microstructural transformation. Therefore, the identification of the chemically crystallographic phases, microstructure and pore distribution in these extreme temperature conditions become essential to the understanding of the cementitious materials behavior.
Therefore, the objective of this work is to study the effect of different polymer concentrations (polyurethane foam-PU) and 40% of silica in cement pastes submitted to high temperature, 300° C. Analyses such as X-ray Diffraction (XRD) and Scanning Electron Microscopy (SEM-FEG ZEIZZ) were performed in cement slurries that were prepared and cured for 14 days in the Well Cementation Laboratory at the Federal University of Rio Grande do Norte-UFRN.
Materials and methods
Calculations and formulations of cement pastes
Based on the materials concentration preset and water/cement ratio of the mixture, the cement slurries compositions were made. In order to obtain various properties of the paste, its specific gravity and the solid and liquid additives concentrations were fixed.
It is important to highlight that all calculations were performed in accordance with the API RP 10B standard. It is essential to know the absolute densities of the materials that are going to be used in the formulations, in order to perform the calculations. An experimental planning flowchart in presented Figure 1.

The slurries were prepared for a number of components, in order to obtain a final volume of 600 cm3, which is the necessary value to perform the laboratory tests, according to API standards for oil wells. The materials used in the preparation of the pastes were weighted on a digital scale with a resolution of 0.01 g.
Four formulations of cement pastes were evaluated: a standard slurry (PU0), and another three with the addition of polyurethane: PU1 (1gpc), PU2 (2gpc) and PU3 (3gpc) with a vertical depth of 350 m. The initial formulations were made with the aid of the program Schedule assuming a density of 15.6 lb/gal and geothermal gradient of 2.2 °F/100 ft, the BHCT and BHST values were adjusted to a depth of 350 meters.
The concentrations of the cement main additives that were add to the formulated slurry are listed in Table 1. It is noticed that the water/cement ratio decreased as the concentration of PU increased in the formulations.
Table 1: Concentration of the material used in the formulations of cement pastes.
| Formulations | Formulation material (Gramas) | Water/Cement ratio | ||||
|---|---|---|---|---|---|---|
| Cement | Silica (40%) | Water | Antifoam | Polyurethane (PU) | ||
| PU0 | 561,33g | 224,53g | 334,92g | 0,76g | 0 | 59,67 |
| PU1 | 559,03g | 223,61g | 286,53g | 0,76g | 52,62g | 51,25 |
| PU2 | 556,74g | 222,7g | 238,52g | 0,76g | 102,83g | 42,84 |
| PU3 | 554,48g | 221,79g | 190,91g | 0,76g | 153,61g | 34,43 |
The slurries with 1 gpc (gallon per cubic foot), 2 gpc and 3 gpc of Polyurethane (PU), as well as the formulation without PU, were analyzed at 300° C, a typical temperature in the process of steam injection.
Sample preparation and mixture
During preparation, the cement slurries samples were subjected to a process of particle size classification, using a standard mesh sieve, aimed to remove thick particles that could cause trouble on the tests, as well as to determine the presence of contaminants and early hydrated grains. All materials used in the pastes preparation were weighted using an analytical balance.
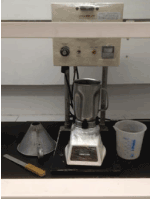
To the admixture, a mixer Chandler 80-60 model, as shown in Figure 2, was used. The polyurethane was previously mixed with the special Portland cement samples through manual stirring. The admixtures were performed by turning on the mixer, containing water, at low speed (4000 rpm ± 200 rpm), placing the Portland cement and silica content of each sample using a short neck funnel, through the lid central opening in 15s, keeping the rotation speed constant. The time control was made with the mixer timer. After the solid part had been continuously added to the water, the mixing continue at high speed (rpm 12000 ± 500 rpm) during 35 s, turning off the mixer after this period. This rotation values and times are defined in order to reproduce in the laboratory the mixing energy values achieved in field operations.
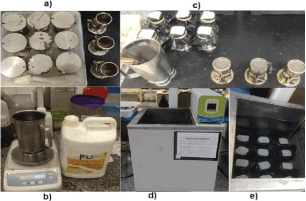
The Figure 3 presents the molds preparation (Fig. 3a), material weighing (Fig. 3b), molding stage of the slurries (Fig. 3 c) and the heat bath at 38° C during 11 days (Fig. 3d and 3e).
Cement pastes curing period
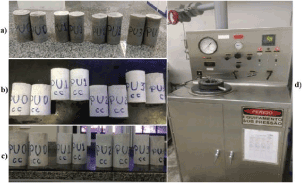
Immediately after the preparation of the cementitious material, the slurries were reallocated into molds and then, they were submitted to heat bath at 38°C for 11 days for the formulations. They were submitted to 3 days of curing inside of a curing chamber at 300° C after this. Figure 4.
Proposed laboratory tests
In this experimental study, the following laboratory tests were conducted using Portland cement additivated slurries, polyurethane (PU) and 40% of Silicon: X-ray Diffraction (XRD) and Scanning Electron Microscopy (SEM-FEG ZEIZZ).
Results and discussion
X-ray Diffraction (XRD)
The silica content in all the formulations was 40%. The standard slurry (PU0) did not received any concentration of PU, the samples PU1, PU2 and PU3 received 1gpc, 2gpc and 3gpc of PU respectively. These samples were subjected to 14 days of curing, being removed from the thermal bath at 38° C on day 11 and placed into a curing chamber for 3 days at 300° C (572° F). Then the cured cement formulations were ground into fine particles using a mortar and pestle, and dried inside a laboratory stove for 2 hours at 48° C. The dried cement powders were analyzed by XRD in continuous mode using a D8 ADVANCE equipment from Bruker ranging from 0 to 80 degrees with a power of 1000 W and copper anode (Cu), using a nickel (Ni) filter detector.
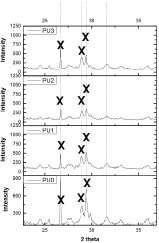
The XRD made it possible to identify different phases of the samples, noticing in all difratograms the formation of a highly stable crystal phase at high temperatures, the xonotlite (composed of a high calcium/silicon ratio), that can be confirmed in Figure 5.
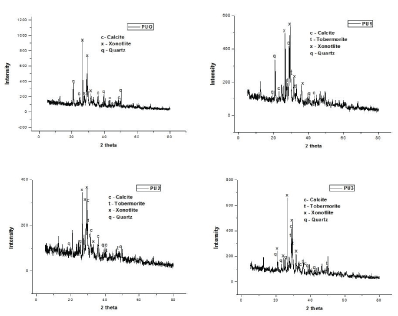
According to Roderick & Santra [12-15], xonotlite is a product from the alteration of tobermorite. This is the predominant usual phase formed at temperatures below 300° F (148.9° C). Based on the identification of the crystal phase, analyzing the Fig. 5 in the formulations PU1, PU2 and PU3, it is confirmed a small amount of tobermorite and if a longer curing period was applied probably it would eliminated totally the xonotlite formation [16-18].
It is important to notice that the hydration product, specially the tobermorite, is formed from cementing systems that contain silica, zeolite or a combination of both. Some Synchrotron studies suggest the use of a two-step mechanism, in order to form a highly ordered crystalline formation of tobermorite or xonotlite from a low crystalline C-S-H gel phase at 300° F (148.9° C) and 590° F (310° C).
No PU was identified during the XRD analysis, since the equipment used in this work only identifies the crystallographic phases in the samples compositions. However, there is a hypothesis that those different PU concentrations may have altered the formation process of xonotlite in the specimens, Fig. 5, once that a small amount of tobermorite was identified in the samples with PU and it was not identified in sample PU0. Although, Roderick & Santra [12] research showed that the difratograms did not identified tobermorite in the formulations with 40% silica that were subjected to high temperatures during the same curing time and without PU addition [19].
In Fig. 8 it is observed the behavior of the peaks in the formulations highlighted by the vertical dotted line. The dotted line shows the existence of a correlation between the peaks of xonotlite, a crystalline product formed when the tobermorite is subjected to 150°C. In Figure 6, the temperature range where the xonotlite is formed in calcium silicate materials is highlighted.
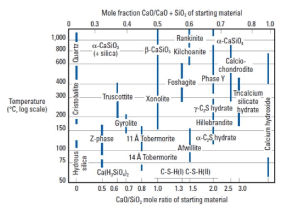
The work of Costa et al. [2] also evaluated the xonotlite formation at extreme temperature, 300° C, in slurries with 40% of silica during two periods of curring, 7 and 28 days [20-22]. The Figure 7 shows the verification of the xonotlite crystalline at 300° C, the results of Costa et al. [2] did not found tobermorite results in any samples. Figure 8.
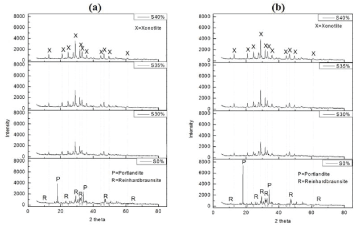
Figure 7: (a) XRD analyses of 0%, 30%, 35% and 40% of SiO2samples with 7 days of curing at 300°C. (b) XRD analyses of 0%, 30%, 35% and 40% of SiO2 samples with 28 days of curing at 300°C. Adapted from Costa et al. (2017).
Scanning Electron Microscopy (SEM)
The samples were placed in desiccator for 2 days before the SEM-FEG ZEIZZ test, in order to meet the equipment conditions. A high efficiency annular type secondary electron detector equipment model Auriga from ZEIZZ was used in this work.
The SEM-FEG analysis enable to perform observations regarding the C-S-H gel crystalline phases, microstructure and pore distribution of a sample collected from the inner part of each cylindrical specimen, with 2 cm x 4cm.
The Figure 9 shows a picture of the standard sample (PU0) and it is possible to observe the existence of a pores microstructure on the surface of Fig. 1 (a), with 2 µm in diameter due to a 3000 times zoom. As the zoom increases 6 (Fig. 9b), 9 (Fig. 9c) 10 (Fig. 9d), 15 (Fig. 9e) and 20 (Fig. 9f) thousand times the resolution of the image, is possible to observe the existence of a pore distribution in the images of Fig. 9.
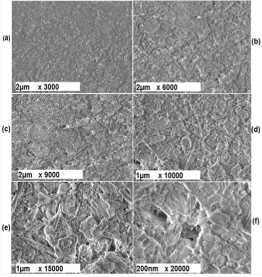
With the addition of polyurethane in the formulations PU1, PU2 and PU3, following the concentrations previously cited, it is possible to notice in Figures 10-12 a decrease in the microstructure and distribution of pores along the specimens surfaces that were investigated. This evidence is confirmed when the resolution of these images is increased. The porosity reduction certainly made the Polyurethane (PU) additivated formulations less permeable, i.e., the permeability decreased as the concentration of PU increased.
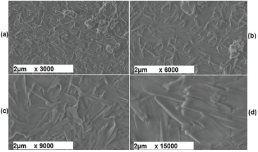
Figure 10: Scanning Electron Microscopy (SEM-FEG) of the formulation PU1 in different diameters and sizes. In Fig. 1 (a) the image has 2 µm in diameter and zoom of 3.0 k. (b) It has 2 µm in diameter and zoom of 6.0 k times. (c) It has 2 µm in diameter and zoom of 9.0 k times. (d) The image has 1 µm in diameter and zoom of 15.0 k times.
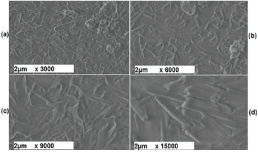
Figure 11: Scanning Electron Microscopy (SEM-FEG) of the formulation PU2 in different diameters and sizes. In Fig. 1 (a) the image has 2 µm in diameter and zoom of 3.0 k. (b) It has 2 µm in diameter and zoom of 6.0 k times. (c) It has 2 µm in diameter and zoom of 9.0 k times. (d) The image has 1 µm in diameter and zoom of 15.0 k times.
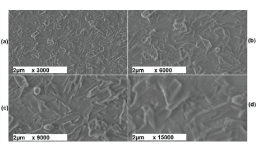
Figure 12: Scanning Electron Microscopy (SEM-FEG) of the formulation PU3 in different diameters and sizes. In Fig. 1 (a) the image has 2 µm in diameter and zoom of 3.0 k. (b) It has 2 µm in diameter and zoom of 6.0 k times. (c) It has 2 µm in diameter and zoom of 9.0 k times. (d) The image has 1 µm in diameter and zoom of 15.0 k times.
Conclusion
The investigation of Portland cement slurries with Polyurethane (PU) additives in the formulations PU1, PU2 and PU3 in different concentrations and with 40% of silica allowed to perform a study with satisfactory results. Pastes with Silica additive, for example, showed results that confirm and corroborate with several studies found in the literature. Almost all researches reported the use of SiO2 enriched materials as compulsory in cementation project of oil wells when Portland cement paste is subjected to temperatures above 110° C.
With the XRD technique, it was possible to verify the presence of xonotlite, a stable C-S-H phase that is responsible for strength gain, in all the formulations. In papers published in literature, the presence of tobermorite at 300° C was not identified, however, in this study it was verified the presence of tobermorite in the samples with PU. It is believed that the polyurethane interfered in the xonotlite crystallographic formation process, once that this crystal is formed by tobermorite in high temperatures.
Through scanning electronic microscopy (SEM-FEG ZEIZZ), it was found that with the addition of polyurethane in PU1, PU2 and PU3 in the studied concentration, there was reduced pore microstructure and distribution. This evidence is confirmed by increasing the resolution in the images and also for check the distributed pores in the microstructure of PU0 formulation. So, with the decrease of porosity certainly also reduced permeability on the bodies-of-proof with PU additives concentrations.
References
- THOMAS JE Fundamentos de Engenharia do Petróleo. Rio de Janeiro: Editora
- Costa BLS, Souza GG, Freitas JCO, Araujo RGS, Santos PHS, et al. (2017) Silica content influence on cement compressive strength in wells subjected to steam injection. Journal of petroleum science and engineering 158: 626 - 633.
- Ichim A, Teodoriu HC (2017) Investigations on the surface well cement integrity induced by thermal cycles considering an improved overall transfer coefficient. J. Pet.Sci. Eng. 154: 479-487.
- Bu Y, Chang Z, Du J, Liu D (2017) Experimental study on the thermal expansion property and mechanical performance of oil well cement with carbonaceous admixtures. Royal Society of chemistry 7: 29240-29254.
- SALIM P, AMANI M (2013) Special Considerations in Cementing High Pressure High Temperature Wells. International Journal of Engineering and Applied Sciences 1: 120-143.
- AKTAN T, ALI SM (1978) Finite-Element Analysis of Temperature and Thermal Stresses Induced by Hot Water Injection. Society of Petroleum Engineers Journal 18: 457-469.
- THIERCELIN MJ et al. (1998) Cement design based on cement mechanical response. SPE drilling & completion, 13, n. 04, 266-273.
- GARNIER A, et al. (2010) An Innovative Methodology for Designing Cement-Sheath Integrity Exposed to Steam Stimulation. SPE Drilling \& Completion 25: 58-69.
- FREITAS JJD (2007) Validação de uma Metodologia de Ensaio de Resistência ao Cisalhamento para Avaliação da Aderência de InterfacesRevestimento Metálico-Bainha de Cimento Aplicada aPoços de Petróleo. Dissertação de Mestrado, Universidade Federal do Rio Grande do Norte.
- Paiva M das DM (2008) Otimização e análise mecânica de pastas geopoliméricas para uso em poços sujeitos à injeção cíclica de vapor. Universidade Federal do Rio Grande do Norte.
- CORREIA RF, et al. (2010) Análise Numérica de Teste Experimental de Poço de Petróleo XXIX: 9739-9757.
- Pernites RB, Santra AK (2016) Portland cement solutions for ultra-high temperature wellbore applications. Cem. Concr. Compos. 72: 89-103.
- API (2013) API Recommended Practice 10B-2-recommended Practice for Testing Well Cements, second ed. American Petroleum Institute, Washington.
- Alvarez J, Han S (2013) Current overview of cyclic steam injection process. J. Pet. Sci. Res.
- Bezerra UT, Martinelli AE, Melo DMA, Melo MAF, Oliveira VG, et al. (2011) The strength retrogression of special class Portland oilwell cement. Cerâmica 57: 150-154.
- EJ Sellevold, Ø Bjøntegaard (2006) Coefficient of thermal expansion of cement paste and concrete: mechanisms of moisture interaction. Mater. Struct. 39: 809-815.
- GK White (1993) Solids: thermal expansion and contraction. Contemp. Phys 34: 193-204.
- I Maruyama, A Teramoto (2011) Impact of time-dependant thermal expansion coefficient on the early-age volume changes in cement pastes. Cem. Concr. Res 41: 380-391.
- Nelson EB, Guillot D (2006) Well Cementing, Second. ed. Schlumberger, Sugar Land, Texas.
- Tomilina EM, Chougnet-SIrapian A, et al. (2012) New thermally responsive cement for heavy oil wells, in: SPE Heavy Oil Conference Canada. Society of Petroleum Engineers.
- Taylor HFW (1990) Cement Chemistry, first ed. Thomas Telford, London.
- Debode J, Van Hemelrijck W, Heungens K, Maes M, Creemers P (2011) First Report of Pilidium concavum Causing Tan-Brown Rot on Strawberry Fruit in Belgium. Plant Dis 95: 1029. [crossref]
